NASA
Global Climate Change
Vital Signs of the Planet
Skip Navigation
menu close modal

MULTIMEDIA

Interactive: Eyes on the Earth

Eyes on the Earth

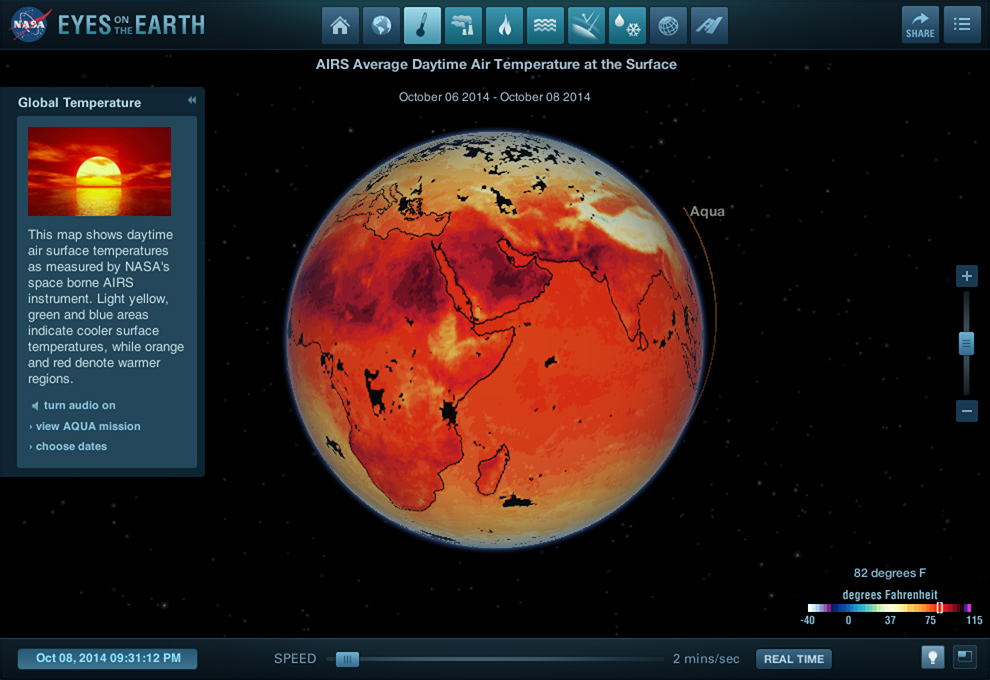
Track Earth's vital signs and fly along with NASA's Earth-observing satellites. See natural hazards from space, view near real-time science data and keep an Eye on our planet's heath with this stunning 3D visualization.

› launch full-screen visualization

Enlarge

More Like This

  • Interactives
  • Atmosphere
  • Land change
  • Oceans and ice

Related

B-roll for media on the sea level-observing Sentinel-6 Michael Freilich satellite.
More
Video: Sentinel-6 Michael F...
Video: Sentinel-6 Michael Freilich Media Reel
Test your knowledge about global temperature change and its impact on Earth's climate.
More
Test your knowledge about g...
Quiz: Global warming
The relentless rise of carbon dioxide levels in the atmosphere.
More
The inexorable rise of carb...
Graphic: The relentless rise of carbon dioxide
Video: A visualization of the annual Arctic sea ice "minimum" for each year from 1979 through 2022.
More
Annual Arctic sea ice minim...
Video: Annual Arctic Sea Ice Minimum 1979-2022 with Area Graph
Captured onboard a NASA Operation IceBridge flight to survey glacier change in a warming world, this photograph shows a beach and stream in Russel Fjord, Alaska, near the terminus of Hubbard Glacier.
More
Beached bergs in Alaska
This animation shows the change in atmospheric nitrogen dioxide (NO2) levels as a result of COVID-19 stay-at-home restrictions.
More
COVID-19 Mitigation Leads t...
COVID-19 Mitigation Leads to Reduced Pollution Associated with Decreased Fossil Fuel Use
Video: Images created from GRACE data showing changes in Antarctic ice mass since 2002.
More
Antarctic ice loss 2002-2016
Video: Antarctic ice loss 2002-2016
NASA's new Orbiting Carbon Observatory-2 space satellite will probe the carbon cycle like never before, telling us where the carbon is going and giving us clues as to where we will end up.
More
Atmospheric carbon dioxide ...
Graphic: Measuring carbon dioxide from space
Graphic: Global surface temperature changes versus the Sun's energy that Earth receives in watts (units of energy) per square meter since 1880.
More
Temperature vs Solar Activity
Graphic: Temperature vs Solar Activity
Video: NASA scientists release the first new global map of Earth at night since 2012.
More
Video: Lights of human acti...
Video: Lights of human activity shine in NASA's image of Earth at night
Visualization of 30 named storms during the 2020 hurricane season
More
Video: 2020 Hurricane Season
Karen St. Germain, NASA's director of Earth science, gave a presentation at the 2021 United Nations Climate Change Conference.
More
Video: What NASA Knows from...
Video: What NASA Knows from Decades of Earth System Observations
The past decade has been the hottest ever recorded since global temperature records began 150 years ago. This video discusses the impacts of the sun's energy, Earth's reflectance and greenhouse gasses on global warming.
More
The past decade has been th...
Video: Temperature Puzzle
The water cycle is a never-ending global process of water circulation from clouds to the land, to the ocean, and back to the clouds. Print this page to color with your kids at home.
More
Coloring Page: The Water Cycle
A quick guide to the science behind sea level rise from an ice-loss perspective, what it means in relatable terms and why it matters.
More
On Thin Ice: Why Ice Loss M...
On Thin Ice: Why Ice Loss Matters
Land. Water. Fire. Ice. These elements are basic ingredients that make up planet Earth. Take a moment to admire the magnificent spectacle of our stunning home planet from the perspective of space.
More
Land. Water. Fire. Ice. The...
Video: Majestic Planet
Video: Global sea level rise is accelerating incrementally over time rather than increasing at a steady rate.
More
New study finds sea level r...
Video: New study finds sea level rise accelerating
We know seas are rising and we know why. The urgent questions are by how much and how quickly.
More
Infographic: Sea level rise
This video shows the accumulation of atmospheric carbon dioxide (CO2) during a single calendar year.
More
Global Carbon Dioxide: 2020...
Global Carbon Dioxide: 2020-2021
​ A spring phytoplankton bloom off of the Alaskan coast.
More
Churning in the Chukchi Sea
Video: Explore how scientists determine glacial speed from space.
More
At glacial speed
Video: At glacial speed
This movie shows the evolution of several regions of the Greenland Ice Sheet between 2008 and 2300 based on three different climate scenarios.
More
Greenland Ice Sheet: Three ...
Greenland Ice Sheet: Three Futures
This visualization shows total sea level change between 1992 and 2019, based on data collected from the TOPEX/Poseidon, Jason-1, Jason-2, and Jason-3 satellites.
More
Video: 27-Year Sea Level Rise
Satellite scatterometer missions make essential measurements to support weather and marine forecasting. Learn more about how they work, why they measure ocean winds, and what the QuikScat mission accomplished during its time in orbit.
More
QuikScat: A Pioneer of Sate...
QuikScat: A Pioneer of Satellite Scatterometry (Video)
The IPCC's four key findings
More
The IPCC's four key findings
Graphic: The IPCC's four key findings
more resources

Explore

Interactives, galleries and apps

Images of Change

Images of Change

Explore a stunning gallery of before-and-after images of Earth from land and space that reveal our home planet in a state of flux.
More
Climate Time Machine

Climate Time Machine

Travel through Earth's recent climate history and see how increasing carbon dioxide, global temperature and sea ice have changed over time.
More
Eyes on the Earth

Eyes on the Earth

Track Earth's vital signs from space and fly along with NASA's Earth-observing satellites in an interactive 3D visualization.
More
Global Ice Viewer

Global Ice Viewer

Earth's ice cover is shrinking. See how climate change has affected glaciers, sea ice, and continental ice sheets.
More
more multimedia

Get the Newsletter

Stay Connected

Facts

    • Evidence
    • Causes
    • Effects
    • Scientific Consensus
    • What Is Climate Change?
    • Vital Signs
    • Extreme Weather
    • Questions (FAQ)

News

    • News and Features
    • Subscribe
    • Climate Newsletter Archive

Solutions

    • Earth Science in Action
    • Mitigation and Adaptation
    • Sustainability and Government Resources

Explore

    • Images of Change
    • Earth Minute Videos
    • Interactives
    • Beautiful Earth Gallery
    • Ask NASA Climate
    • Evidence for Earth's Past Climate

NASA Science

    • Science Mission Directorate
    • NASA Data Resources
    • Earth System Science
    • Earth Science Missions
    • History
    • People

More

    • For Media
    • For Educators
    • Multimedia
    • En español
    • For Kids
  • Feedback
  • |
  • Awards
  • |
  • Sitemap
  • |
  • Earth Observatory
  • |
  • SEA LEVEL CHANGE
  • |
  • Privacy
  • |
  • Climate Data Initiative
  • |
  • U.S. CLIMATE RESILIENCE TOOLKIT

This website is produced by the Earth Science Communications Team at

NASA's Jet Propulsion Laboratory | California Institute of Technology

Site last updated: September 21, 2023