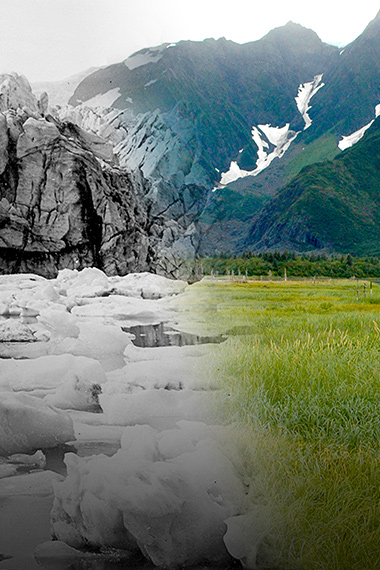
NASA
Global Climate Change
Vital Signs of the Planet
Skip Navigation
menu close modal

MULTIMEDIA

Icy Bay, Alaska

Icy Bay, Alaska

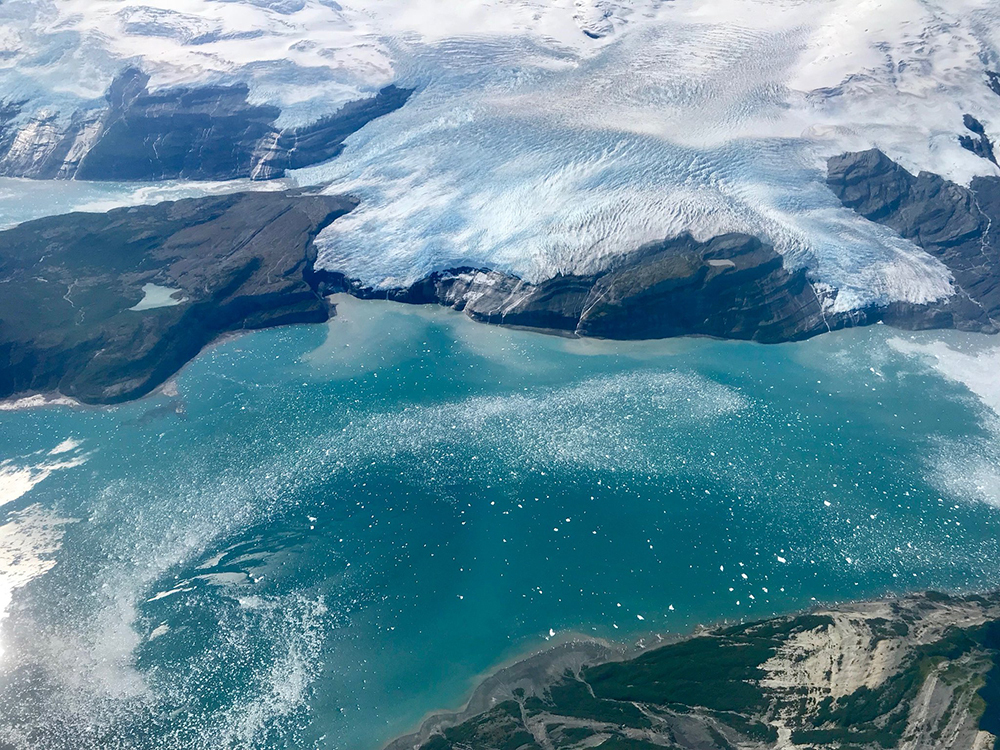
From NASA's Operation IceBridge campaign in Alaska: A high altitude view of Icy Bay, in the Wrangell-Saint Elias Wilderness. Just a century ago, this body of water was covered in ice.

Credit

NASA ICE Twitter Feed

Enlarge

Downloads

2048x1536
762 KB
image/jpeg
Download

More Like This

  • Images
  • Oceans and ice

Related

The sun sets over NASA's Kennedy Space Center in Florida, on October 13, 2010.
More
Vivid Sunset
Vivid sunset
This image, taken on 10 May 2001, shows one of the islands of New Caledonia, an archipelago 1200 kilometers (750 miles) east of Australia. New Caledonia contains the world’s third-largest coral reef structure, and its coral reefs support an unusually large diversity of species, including many predators, big fish, turtles, and the world’s third-largest dugong population. (Dugongs are large marine mammals.) In this natural-color image, the islands appear in shades of green and brown — mixtures of vegetation and bare ground. The surrounding waters range from pale aquamarine to deep blue, and the color differences reflect varying water depths. Over coral reef ridges and sand bars, the water is shallowest and palest in color.
More
Blue Lagoon
Blue lagoon
In this image, we see blue silt off the southern coast of Louisiana as the Mississippi River flows off into the Gulf of Mexico. The brightness and shade of blue depends on the density of the silt and the depth of the silt-carrying currents in the water. The small bright dots in the scene are fishing boats and oil platforms.
More
In this image, we see blue ...
Louisiana silt
In this image, it’s hard to get a sense of scale or of what we’re actually looking at. This picture, taken by the Landsat-5 satellite on 8 April, 1985, shows sand dunes (yellow streaks) that extend from Algeria into Mauritania in northwest Africa. These wind-blown sand ridges make up Erg Iguidi, one of the Sahara’s ‘sand seas’ in which individual dunes are often more than a third of a mile (500 meters) wide and tall.
More
Sea of Sand
Sea of sand
Byrd Glacier, Antarctica, is a 15-mile- (24-kilometer-) wide, 100-mile- (161-kilometer-) long ice stream that plunges through a deep valley in the Transatlantic Mountains and into the Ross Ice Shelf. It moves towards the sea at a rate of about half a mile (0.8 kilometers) per year. This snapshot of the glacier was taken on January 11, 2000.
More
Byrd Glacier is a 15-mile- ...
Byrd Glacier
This spectacular 'blue marble' image is the most detailed true-color image of the entire Earth to date. Using a collection of satellite-based observations, scientists and visualizers stitched together months of observations of the land surface, oceans, sea ice, and clouds into a seamless, true-color mosaic of every square kilometer (0.4 square miles) of our planet. Much of the information contained in this image came from NASA’s Moderate Resolution Imaging Spectroradiometer (MODIS) onboard the Terra satellite. Visualization date: August 2, 2002.
More
BLUE MARBLE: This spectacul...
Blue marble
Like distant galaxies amid clouds of interstellar dust, chunks of sea ice drift through graceful swirls of grease ice in the frigid waters of Foxe Basin in the Canadian Arctic.
More
Ice Stars
Ice Stars
An animation shows global sea level trends from 1993 to 2022 as observed by several satellite missions.
More
Video: Tracking 30 Years of...
Video: Tracking 30 Years of Sea Level Rise
This visualization shows sea surface temperature (SST) data from January 2016 through March 2020.
More
Sea Surface Temperature (SS...
Sea Surface Temperature (SST) from January 2016 through March 2020
The past decade has been the hottest ever recorded since global temperature records began 150 years ago. This video discusses the impacts of the sun's energy, Earth's reflectance and greenhouse gasses on global warming.
More
The past decade has been th...
Video: Temperature Puzzle
This image, taken on 4 July 2002, shows spiraling eddies known as von Karman vortices over Alaska’s Aleutian Islands. Such eddies form as air flows over and around objects in its path. In this case, these eddies were created when prevailing winds sweeping east across the northern Pacific Ocean encountered Alaska’s Aleutian Islands.
More
Extraordinary Eddies
Extraordinary eddies
Manam Volcano in Papua New Guinea, as seen from space on June 16, 2010. Located 13 kilometers (8 miles) off the coast of mainland Papua New Guinea, Manam forms an island 10 kilometers (6 miles) wide. It is a stratovolcano. The volcano has two summit craters, and although both are active, most historical eruptions have arisen from the southern crater. On June 16, the volcano released a thin, faint plume as clouds clustered at the volcano's summit. Rivulets of brown rock interrupt the carpet of green vegetation on the volcano’s slopes. White clouds partially obscure the satellite’s view of Manam. The clouds may be the result of water vapor from the volcano, but they may also have formed independently of volcanic activity. The volcanic plume appears as a thin blue-gray veil extending toward the northwest over the Bismarck Sea.
More
MANAM VOLCANO: Manam Volcan...
Manam Volcano
Video: total sea level change between 1992 and 2014, based on data collected from the TOPEX/Poseidon, Jason-1 and Jason-2 satellites.
More
Video: 22-year sea level rise
Animation showing changes in Greenland ice mass since 2002 based on satellite data.
More
Video: Greenland Ice Mass L...
Video: Greenland Ice Mass Loss 2002-2023
Earth and its Moon are nicely framed in this image taken from the aft windows of the Space Shuttle Discovery in 1998. Discovery, on mission STS-95, was flying over the Atlantic Ocean at the time this image was taken.
More
MOON FRAME: Earth and its M...
Moon frame
Earth's city lights as seen from space. The brightest areas of the Earth are the most urbanized, but not necessarily the most populated. More than a century after the invention of the electric light, many parts of the planet remain thinly populated and unlit. Image created with data from the Defense Meteorological Satellite Program Operational Linescan System.
More
NIGHT LIGHTS: Earth's city ...
Night lights
​ A spring phytoplankton bloom off of the Alaskan coast.
More
Churning in the Chukchi Sea
Salinity plays a major role in global ocean circulation and changes in salinity may impact regional and global climates. NASA's Aquarius mission is painting a global picture of our planet's salty waters.
More
Salinity plays a major role...
Video: Aquarius
We know seas are rising and we know why. The urgent questions are by how much and how quickly.
More
Infographic: Sea level rise
Karen St. Germain, NASA's director of Earth science, gave a presentation at the 2021 United Nations Climate Change Conference.
More
Video: What NASA Knows from...
Video: What NASA Knows from Decades of Earth System Observations
This movie shows the evolution of several regions of the Greenland Ice Sheet between 2008 and 2300 based on three different climate scenarios.
More
Greenland Ice Sheet: Three ...
Greenland Ice Sheet: Three Futures
A series of rocky outcroppings are a prominent feature of this Sahara Desert landscape near the Terkezi Oasis in the country of Chad. This image was taken by the Landsat 7 satellite on October 22, 2000. It is a false-color composite image made using near infrared, green, and red wavelengths. The image has also been sharpened using the sensor's panchromatic band.
More
Terkezi Oasis
Terkezi Oasis
This visualization shows total sea level change between 1992 and 2019, based on data collected from the TOPEX/Poseidon, Jason-1, Jason-2, and Jason-3 satellites.
More
Video: 27-Year Sea Level Rise
This map shows the bright lights of cities and wildfires set against the inky black backdrop of night. The image is actually a composite of satellite data collected over a number of days in April 2012 and October 2012, and is the result of 312 orbits and 2.5 TB of information. The lights seen here are not just from cities; they are also from wildifires, lightning, gas flares and reflected moonlight. Because the image is a composite of several days’ worth of data, fires and other points of light may have been picked up by the satellite and integrated into the composite image even though they were temporary, making some rural locations (such as in Australia) seem brighter than they really are on a typical day.
More
Night lights, big cities
This animation shows the movement of carbon dioxide between the air and sea with the help of ocean surface winds from Jan. 3, 2012 to Aug. 15, 2012.
More
Video: Movement of Carbon D...
Video: Movement of Carbon Dioxide Between the Air and Sea
more resources

Explore

Interactives, galleries and apps

Images of Change

Images of Change

Explore a stunning gallery of before-and-after images of Earth from land and space that reveal our home planet in a state of flux.
More
Climate Time Machine

Climate Time Machine

Travel through Earth's recent climate history and see how increasing carbon dioxide, global temperature and sea ice have changed over time.
More
Eyes on the Earth

Eyes on the Earth

Track Earth's vital signs from space and fly along with NASA's Earth-observing satellites in an interactive 3D visualization.
More
Global Ice Viewer

Global Ice Viewer

Earth's ice cover is shrinking. See how climate change has affected glaciers, sea ice, and continental ice sheets.
More
more multimedia

Get the Newsletter

Stay Connected

Facts

    • Evidence
    • Causes
    • Effects
    • Scientific Consensus
    • What Is Climate Change?
    • Vital Signs
    • Extreme Weather
    • Questions (FAQ)

News

    • News and Features
    • Subscribe
    • Climate Newsletter Archive

Solutions

    • Earth Science in Action
    • Mitigation and Adaptation
    • Sustainability and Government Resources

Explore

    • Images of Change
    • Earth Minute Videos
    • Interactives
    • Beautiful Earth Gallery
    • Ask NASA Climate
    • Evidence for Earth's Past Climate

NASA Science

    • Science Mission Directorate
    • NASA Data Resources
    • Earth System Science
    • Earth Science Missions
    • History
    • People

More

    • For Media
    • For Educators
    • Multimedia
    • En español
    • For Kids
  • Feedback
  • |
  • Awards
  • |
  • Sitemap
  • |
  • Earth Observatory
  • |
  • SEA LEVEL CHANGE
  • |
  • Privacy
  • |
  • Climate Data Initiative
  • |
  • U.S. CLIMATE RESILIENCE TOOLKIT

This website is produced by the Earth Science Communications Team at

NASA's Jet Propulsion Laboratory | California Institute of Technology

Site last updated: September 21, 2023