NASA
Global Climate Change
Vital Signs of the Planet
Skip Navigation
menu
close modal
MULTIMEDIA
CO2 video for carbon feature
CO
2
emissions
Related
Video: Explore how scientists determine glacial speed from space.
Video: At glacial speed
Carbon dioxide is the main heat-trapping greenhouse gas that humans emit. How much do you know about it and its impact on global warming and climate change?
Quiz: Carbon dioxide
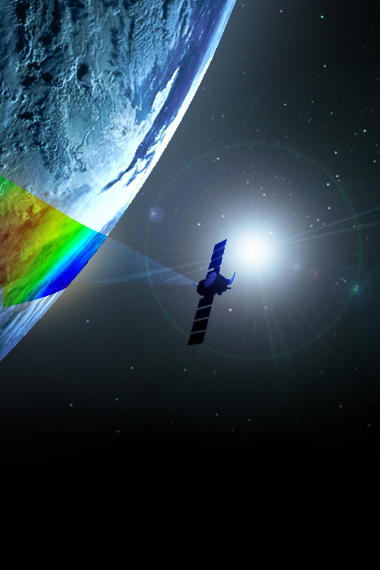
NASA's new Orbiting Carbon Observatory-2 space satellite will probe the carbon cycle like never before, telling us where the carbon is going and giving us clues as to where we will end up.
Graphic: Measuring carbon dioxide from space
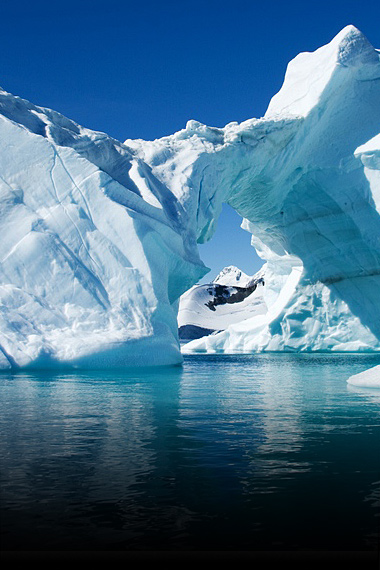
Ubicada en el Ártico cerca del Polo Norte, la isla de Groenlandia está cubierta por una enorme capa de hielo equivalente a tres veces el tamaño de Texas y de 1,6 kilómetros (una milla) de profundidad en promedio.
Hielo de Groenlandia
This animation shows the change in atmospheric nitrogen dioxide (NO
2
) levels as a result of COVID-19 stay-at-home restrictions.
COVID-19 Mitigation Leads to Reduced Pollution Associated with Decreased Fossil Fuel Use
This visualization depicts changes in Antarctic land ice thickness as measured by the ICESat and ICESat-2 satellites.
Antarctic Land Ice Height Change as Measured by ICESat and ICESat-2
Trick or treat? How many pumpkins would it take to equal the mass of the world’s annual fossil fuel carbon dioxide (CO₂) emissions? Hint: This isn’t a trick 👻
Graphic: Carbon Dioxide Emissions as Pumpkins
An animation shows global sea level trends from 1993 to 2022 as observed by several satellite missions.
Video: Tracking 30 Years of Sea Level Rise
Land. Water. Fire. Ice. These elements are basic ingredients that make up planet Earth. Take a moment to admire the magnificent spectacle of our stunning home planet from the perspective of space.
Video: Majestic Planet
Video: Images created from GRACE data showing changes in Antarctic ice mass since 2002.
Video: Antarctic ice loss 2002-2016
NASA Earth Right Now promo
Video: NASA Earth Right Now promo
Earth has about 370,000,000,000,000,000,000 (quintillion) gallons of water, with some sources easier to access and use than others. The water budget tells us where that water is – key information that helps better plan for the future.
Video: Earth's Water Budget
Video: NASA's Oceans Melting Greenland (OMG) and Operation IceBridge missions investigate Greenland's thinning ice sheets from above and below.
Video: Greenland's thinning ice
Color-coded map of changing global surface temperature anomalies from 1880 through 2022.
Video: Global Warming from 1880 to 2022
This movie shows the evolution of several regions of the Greenland Ice Sheet between 2008 and 2300 based on three different climate scenarios.
Greenland Ice Sheet: Three Futures
A visualization shows ocean currents circulating Pine Island Bay and flowing under Pine Island Glacier.
Video: Ocean Flows Under Pine Island Glacier, Antarctica
The carbon dioxide cycle is the movement of carbon dioxide (CO
2
) between the land, the atmosphere, and the ocean. Print this page to color with your kids at home.
Coloring Page: The Carbon Dioxide Cycle
This documentary traces the efforts of NASA’s Jet Propulsion Laboratory to measure greenhouse gases.
JPL and the Space Age: Sky High (Video)
B-roll for media on the sea level-observing Sentinel-6 Michael Freilich satellite.
Video: Sentinel-6 Michael Freilich Media Reel
Head into the field with first responders, fire scientists and forest managers to see what challenges they face and how NASA can help mitigate the effects of longer and more intense fire seasons.
Video: 'Operation Earth: Wildfires'
Los gases de efecto invernadero son vitales para la vida en la Tierra, pero la creciente concentración de ciertos gases, como el dióxido de carbono, está afectando el delicado equilibrio del planeta.
Problema de gas
Video: 25 years of Antarctic land ice elevation change
Video: 25 Years of Antarctic Land Ice Elevation Change Anomalies (West Coast Fly Over)
Video: Simulation of global clouds and aerosols from September 1, 2005, to December 31, 2005.
Video: Simulated clouds and aerosols
Durante más de 20 años, la NASA ha estado rastreando la topografía de la superficie global del océano para comprender el importante papel que desempeña en nuestras vidas.
Aumento del nivel del mar
This animation shows the movement of carbon dioxide between the air and sea with the help of ocean surface winds from Jan. 3, 2012 to Aug. 15, 2012.
Video: Movement of Carbon Dioxide Between the Air and Sea
Explore
Interactives, galleries and apps
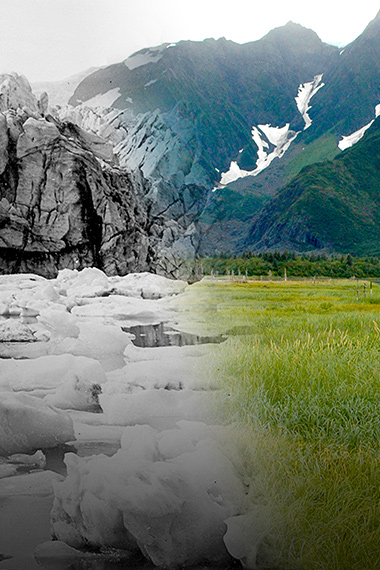
Images of Change
Explore a stunning gallery of before-and-after images of Earth from land and space that reveal our home planet in a state of flux.
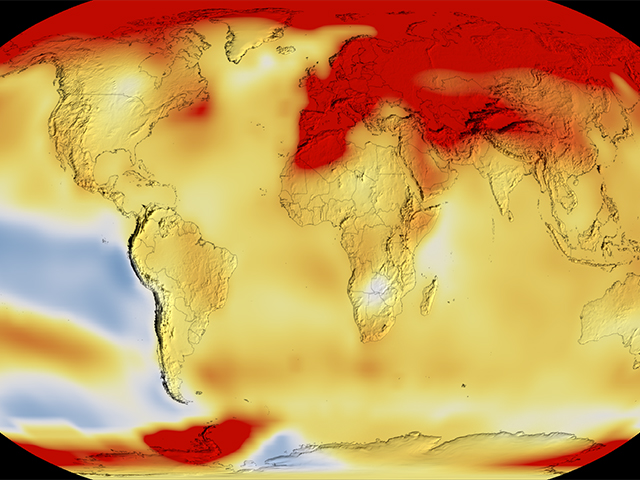
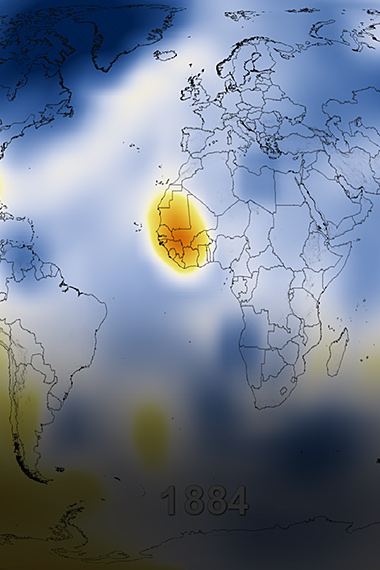
Climate Time Machine
Travel through Earth's recent climate history and see how increasing carbon dioxide, global temperature and sea ice have changed over time.
Eyes on the Earth
Track Earth's vital signs from space and fly along with NASA's Earth-observing satellites in an interactive 3D visualization.
Global Ice Viewer
Earth's ice cover is shrinking. See how climate change has affected glaciers, sea ice, and continental ice sheets.