NASA
Global Climate Change
Vital Signs of the Planet
Skip Navigation
menu close modal

MULTIMEDIA

Video: Oceans of Climate Change

Oceanographer Josh Willis discusses the heat capacity of water, performs an experiment to demonstrate heat capacity using a water balloon and describes how water's ability to store heat affects Earth's climate.

Download the original video.

Credit

NASA JPL

More Like This

  • Videos
  • Global warming
  • Oceans and ice

Related

A view from one of our flying science laboratories over the ice in Greenland during Operation IceBridge.
More
plane 360
Inside NASA's P-3 aircraft
Video: total sea level change between 1992 and 2014, based on data collected from the TOPEX/Poseidon, Jason-1 and Jason-2 satellites.
More
Video: 22-year sea level rise
Satellite scatterometer missions make essential measurements to support weather and marine forecasting. Learn more about how they work, why they measure ocean winds, and what the QuikScat mission accomplished during its time in orbit.
More
QuikScat: A Pioneer of Sate...
QuikScat: A Pioneer of Satellite Scatterometry (Video)
Animation of global water level variability
More
Video: Water Storage in Glo...
Video: Water Storage in Global Hydrological Basins
This visualization depicts changes in Greenland land ice thickness as measured by the ICESat and ICESat-2 satellites.
More
Greenland Land Ice Height C...
Greenland Land Ice Height Change as Measured by ICESat and ICESat-2
NASA's new Orbiting Carbon Observatory-2 space satellite will probe the carbon cycle like never before, telling us where the carbon is going and giving us clues as to where we will end up.
More
Atmospheric carbon dioxide ...
Graphic: Measuring carbon dioxide from space
Trick or treat? How many pumpkins would it take to equal the mass of the world’s annual fossil fuel carbon dioxide (CO₂) emissions? Hint: This isn’t a trick 👻
More
Graphic: Carbon Dioxide Emi...
Graphic: Carbon Dioxide Emissions as Pumpkins
Video: NASA scientists release the first new global map of Earth at night since 2012.
More
Video: Lights of human acti...
Video: Lights of human activity shine in NASA's image of Earth at night
Video: The NASA satellite fleet in 2017, from low Earth orbit to the DSCOVR satellite taking in the million-mile view.
More
Video: NASA's vantage point...
Video: NASA's vantage point to view Earth
With autumn's arrival, chlorophyll begins to cede its dominance in the photosynthetic process, revealing yellow and orange tones on land, while in the ocean and lakes, phytoplankton pigments highlight different water masses and current systems.
More
Changing colors across land...
Photosynthetic pigments by land and sea
Los gases de efecto invernadero son vitales para la vida en la Tierra, pero la creciente concentración de ciertos gases, como el dióxido de carbono, está afectando el delicado equilibrio del planeta.
More
Problema de gas
Problema de gas
Video: Scientists combined an array of NASA satellite observations of Earth with data on human activities to map locations where freshwater is changing around the globe and why.
More
For 15 years, GRACE tracked...
Video: For 15 years, GRACE tracked freshwater movements around the world
Animación simplificada del efecto invernadero.
More
Animación simplificada del ...
Efecto invernadero
Desde 1978, la NASA ha estado monitoreando los vientos oceánicos a través de la dispersometría, cuyos datos han mejorado los pronósticos meteorológicos y de huracanes y nos han ayudado a comprender mejor los patrones climáticos globales.
More
Los vientos oceánicos
Nuestra Tierra tiene fiebre. Nuestros científicos creen que la temperatura de la Tierra podría subir de 3 a 10 grados Fahrenheit durante este siglo.
More
La Tierra tiene fiebre
The visualization shows monthly global temperature anomalies (changes from an average) between the years 1880 and 2022.
More
Video: Climate Spiral (1880...
Video: Climate Spiral (1880-2022)
This visualization shows sea surface temperature (SST) data from January 2016 through March 2020.
More
Sea Surface Temperature (SS...
Sea Surface Temperature (SST) from January 2016 through March 2020
Test your knowledge about global temperature change and its impact on Earth's climate.
More
Test your knowledge about g...
Quiz: Global warming
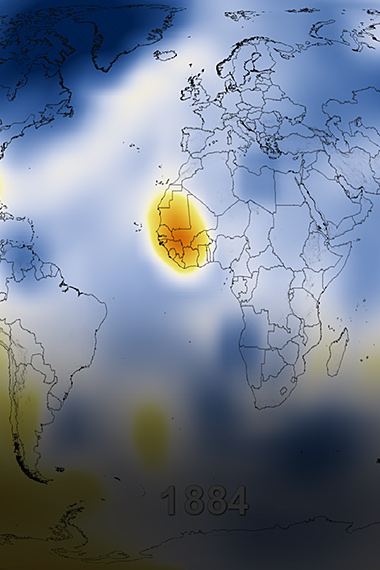
Color-coded map of changing global surface temperature anomalies from 1880 through 2022. 
More
Graphic: Global Warming fro...
Video: Global Warming from 1880 to 2022
Animated GIF of the Sentinel-6 Michael Freilich satellite, scheduled to launch in November 2020.
More
Animated GIF: Sentinel-6 Mi...
Animated GIF: Sentinel-6 Michael Freilich
An animation with voiceover narration showing the global ocean tides as a complex system of rotating and trapped waves with a mixture of frequencies.
More
Video: Global Ocean Tides
Sentinel-6 Michael Freilich will join a long-standing family of Earth-observing satellites from NASA and European partners, including EUMETSAT and the French space agency CNES.
More
Video: Sentinel-6 Michael F...
Video: Sentinel-6 Michael Freilich Satellite Family Tree
Join NASA Earth scientists for a 360-degree view of our planet as they head into the field to study ice in Greenland and coral reefs in Hawaii.
More
360-video of scientists stu...
Earth 360 Video: The Call of Science
Los aerosoles son diminutas partículas sólidas y líquidas suspendidas en la atmósfera.
More
Me llamo Aerosol
Me llamo Aerosol
Animation showing changes in Antarctic ice mass since 2002 based on satellite data.
More
Video: Antarctic Ice Mass L...
Video: Antarctic Ice Mass Loss 2002-2023
more resources

Explore

Interactives, galleries and apps

Images of Change

Images of Change

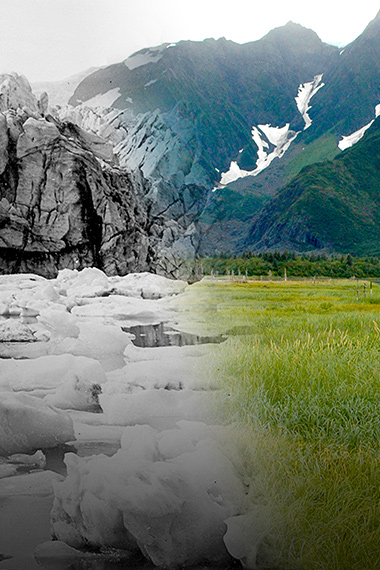
Explore a stunning gallery of before-and-after images of Earth from land and space that reveal our home planet in a state of flux.
More
Climate Time Machine

Climate Time Machine

Travel through Earth's recent climate history and see how increasing carbon dioxide, global temperature and sea ice have changed over time.
More
Eyes on the Earth

Eyes on the Earth

Track Earth's vital signs from space and fly along with NASA's Earth-observing satellites in an interactive 3D visualization.
More
Global Ice Viewer

Global Ice Viewer

Earth's ice cover is shrinking. See how climate change has affected glaciers, sea ice, and continental ice sheets.
More
more multimedia

Get the Newsletter

Stay Connected

Facts

    • Evidence
    • Causes
    • Effects
    • Scientific Consensus
    • What Is Climate Change?
    • Vital Signs
    • Extreme Weather
    • Questions (FAQ)

News

    • News and Features
    • Subscribe
    • Climate Newsletter Archive

Solutions

    • Earth Science in Action
    • Mitigation and Adaptation
    • Sustainability and Government Resources

Explore

    • Images of Change
    • Earth Minute Videos
    • Interactives
    • Beautiful Earth Gallery
    • Ask NASA Climate
    • Evidence for Earth's Past Climate

NASA Science

    • Science Mission Directorate
    • NASA Data Resources
    • Earth System Science
    • Earth Science Missions
    • History
    • People

More

    • For Media
    • For Educators
    • Multimedia
    • En español
    • For Kids
  • Feedback
  • |
  • Awards
  • |
  • Sitemap
  • |
  • Earth Observatory
  • |
  • SEA LEVEL CHANGE
  • |
  • Privacy
  • |
  • Climate Data Initiative
  • |
  • U.S. CLIMATE RESILIENCE TOOLKIT

This website is produced by the Earth Science Communications Team at

NASA's Jet Propulsion Laboratory | California Institute of Technology

Site last updated: September 21, 2023