NASA
Global Climate Change
Vital Signs of the Planet
Skip Navigation
menu close modal

MULTIMEDIA

Video: Oceans of Climate Change

Oceanographer Josh Willis discusses the heat capacity of water, performs an experiment to demonstrate heat capacity using a water balloon and describes how water's ability to store heat affects Earth's climate.

Download the original video.

Credit

NASA JPL

More Like This

  • Videos
  • Global warming
  • Oceans and ice

Related

NASA Earth Right Now promo
More
NASA Earth Right Now promo
Video: NASA Earth Right Now promo
Video: Images created from GRACE data showing changes in Greenland ice mass since 2002.
More
Greenland ice loss 2002-2016
Video: Greenland ice loss 2002-2016
Video: A high-resolution, three-dimensional view of global atmospheric carbon dioxide concentrations from September 1, 2014 to August 31, 2015.
More
Seasonal changes in carbon ...
Video: Seasonal changes in carbon dioxide
This image shows a spinning formation of ice, clouds and low-lying fog off the eastern coast of Greenland. This image was acquired by the Landsat 7 satellite on May 14, 2001. This is a false-color composite image made using infrared, red and green wavelengths.
More
Whirlpool
Whirlpool
This animation compares sea surface salinity (saltiness) data from two NASA datasets from 2015 to 2017.
More
Animation: Sea Surface Sali...
Animation: Sea Surface Salinity (Saltiness) Comparison (2015-2017)
This animation shows the change in atmospheric nitrogen dioxide (NO2) levels as a result of COVID-19 stay-at-home restrictions.
More
COVID-19 Mitigation Leads t...
COVID-19 Mitigation Leads to Reduced Pollution Associated with Decreased Fossil Fuel Use
Test your knowledge of sea level rise and its effect on global populations.
More
Test your knowledge of sea ...
Quiz: Sea level rise
This visualization shows carbon emissions from fires from January 1, 2003 through December 31, 2018. The color bar reflects the quantity of carbon emitted.
More
Carbon Emissions from Fires...
Carbon Emissions from Fires: 2003-2018
A super high-definition view of how carbon dioxide in the air moves around the world with the winds.
More
Super HD view of global car...
Video: Super HD view of global carbon dioxide
Graphic: Global surface temperature changes versus the Sun's energy that Earth receives in watts (units of energy) per square meter since 1880.
More
Temperature vs Solar Activity
Graphic: Temperature vs Solar Activity
NASA explores. From its earliest days of sounding rockets and balloon-borne instruments, to Apollo and Hubble and missions to Mars. This mission of exploration has also always focused on our own corner of the universe, Earth - the home frontier. Earth is still the only planet we've ever been to, as this video explains.
More
NASA explores. From its ear...
Home Frontier
Fly in 360 degrees over Greenland’s craggy glaciers and other ice formations from NASA’s P-3 aircraft.
More
glacier flyover
Greenland's ice from above
Visualization that captures sea surface temperature anomalies around the world from 1982 to 2017.
More
Sea surface temperature ano...
Sea surface temperature anomaly timeline: 1982-2017
​ A spring phytoplankton bloom off of the Alaskan coast.
More
Churning in the Chukchi Sea
Video: Explore how scientists determine glacial speed from space.
More
At glacial speed
Video: At glacial speed
This video shows the accumulation of atmospheric carbon dioxide (CO2) during a single calendar year.
More
Global Carbon Dioxide: 2020...
Global Carbon Dioxide: 2020-2021
Explore Kaneohe Bay with NASA’s CORAL scientists. During field campaigns, scientists take in-water (in situ) measurements to validate the data from airborne instruments.
More
video of divers
Explore Kaneohe Bay with NASA's CORAL scientists
CO2 emissions
More
video about the amount of c...
CO2 video for carbon feature
Ubicada en el Ártico cerca del Polo Norte, la isla de Groenlandia está cubierta por una enorme capa de hielo equivalente a tres veces el tamaño de Texas y de 1,6 kilómetros (una milla) de profundidad en promedio.
More
Hielo de Groenlandia
A visualization of U.S. East Coast ocean flows
More
Video: Ocean Flow Vignettes
En la gráfica se comparan los cambios en la temperatura de la superficie global (línea roja) y la energía del Sol que recibe la Tierra (línea amarilla) en vatios (unidades de energía) por metro cuadrado desde 1880.
More
Temperature vs Solar Activi...
Temperatura vs actividad solar
Global ice viewer interactive
More
Global ice viewer interactive
Interactive: Global ice viewer
This animation shows how various temperature records and Arctic sea ice have changed between 1850 and 2018 from human and natural drivers of climate change.
More
Human and Natural Drivers o...
Human and Natural Drivers of Climate Change (1850-2018)
This documentary traces the efforts of NASA’s Jet Propulsion Laboratory to measure greenhouse gases.
More
JPL and the Space Age: Sky ...
JPL and the Space Age: Sky High (Video)
Video: Images created from GRACE data showing changes in Antarctic ice mass since 2002.
More
Antarctic ice loss 2002-2016
Video: Antarctic ice loss 2002-2016
more resources

Explore

Interactives, galleries and apps

Images of Change

Images of Change

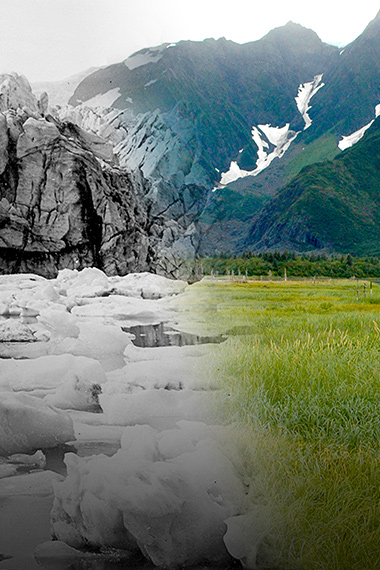
Explore a stunning gallery of before-and-after images of Earth from land and space that reveal our home planet in a state of flux.
More
Climate Time Machine

Climate Time Machine

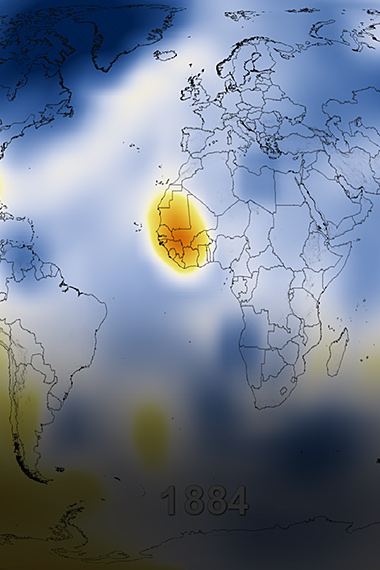
Travel through Earth's recent climate history and see how increasing carbon dioxide, global temperature and sea ice have changed over time.
More
Eyes on the Earth

Eyes on the Earth

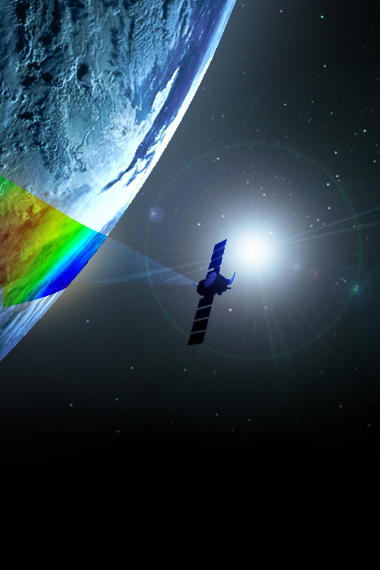
Track Earth's vital signs from space and fly along with NASA's Earth-observing satellites in an interactive 3D visualization.
More
Global Ice Viewer

Global Ice Viewer

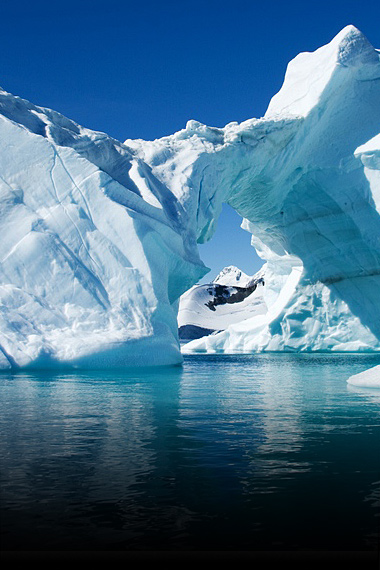
Earth's ice cover is shrinking. See how climate change has affected glaciers, sea ice, and continental ice sheets.
More
more multimedia

Get the Newsletter

Stay Connected

Facts

    • Evidence
    • Causes
    • Effects
    • Scientific Consensus
    • What Is Climate Change?
    • Vital Signs
    • Extreme Weather
    • Questions (FAQ)

News

    • News and Features
    • Subscribe
    • Climate Newsletter Archive

Solutions

    • Earth Science in Action
    • Mitigation and Adaptation
    • Sustainability and Government Resources

Explore

    • Images of Change
    • Earth Minute Videos
    • Interactives
    • Beautiful Earth Gallery
    • Ask NASA Climate
    • Evidence for Earth's Past Climate

NASA Science

    • Science Mission Directorate
    • NASA Data Resources
    • Earth System Science
    • Earth Science Missions
    • History
    • People

More

    • For Media
    • For Educators
    • Multimedia
    • En español
    • For Kids
  • Feedback
  • |
  • Awards
  • |
  • Sitemap
  • |
  • Earth Observatory
  • |
  • SEA LEVEL CHANGE
  • |
  • Privacy
  • |
  • Climate Data Initiative
  • |
  • U.S. CLIMATE RESILIENCE TOOLKIT

This website is produced by the Earth Science Communications Team at

NASA's Jet Propulsion Laboratory | California Institute of Technology

Site last updated: September 21, 2023