NASA
Global Climate Change
Vital Signs of the Planet
Skip Navigation
menu close modal

MULTIMEDIA

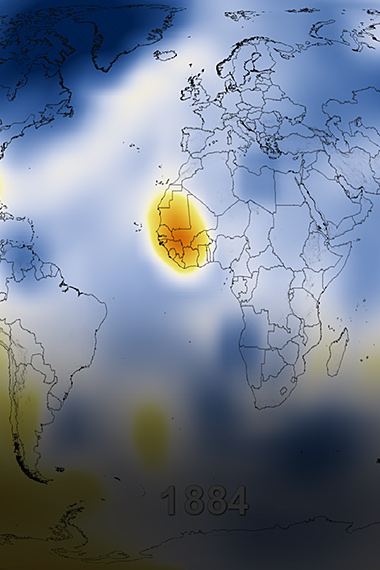
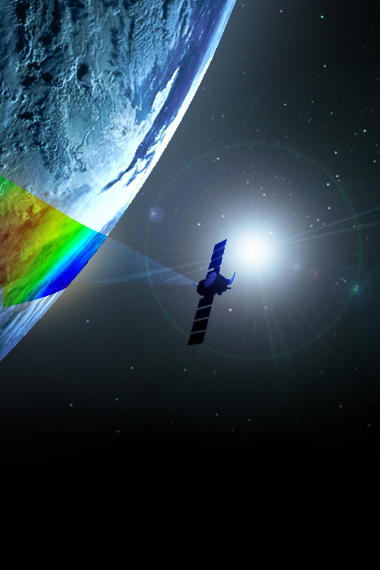
Video: Sting of Climate Change

By comparing bee data to satellite imagery, NASA research scientist Wayne Esaias uses honey bees as tiny data collectors to understand how climate change is affecting pollination and plants.

Download the original video.

Credit

NASA Scientific Visualization Studio

More Like This

  • Videos
  • Climate change myths
  • Global warming

Related

Video: Images created from GRACE data showing changes in Antarctic ice mass since 2002.
More
Antarctic ice loss 2002-2016
Video: Antarctic ice loss 2002-2016
This animation compares sea surface salinity (saltiness) data from two NASA datasets from 2015 to 2017.
More
Animation: Sea Surface Sali...
Animation: Sea Surface Salinity (Saltiness) Comparison (2015-2017)
Video: how different factors, both natural and industrial, contribute to global warming.
More
How global warming stacks up
Video: How global warming stacks up
Karen St. Germain, NASA's director of Earth science, gave a presentation at the 2021 United Nations Climate Change Conference.
More
Video: What NASA Knows from...
Video: What NASA Knows from Decades of Earth System Observations
Video: NASA's Oceans Melting Greenland (OMG) and Operation IceBridge missions investigate Greenland's thinning ice sheets from above and below.
More
Video: Greenland's thinning...
Video: Greenland's thinning ice
This visualization shows carbon emissions from fires from January 1, 2003 through December 31, 2018. The color bar reflects the quantity of carbon emitted.
More
Carbon Emissions from Fires...
Carbon Emissions from Fires: 2003-2018
Head into the field with first responders, fire scientists and forest managers to see what challenges they face and how NASA can help mitigate the effects of longer and more intense fire seasons.
More
Operation Earth: Wildfires
Video: 'Operation Earth: Wildfires'
A visualization of U.S. East Coast ocean flows
More
Video: Ocean Flow Vignettes
La fuerza de la gravedad no solo evita que nos alejemos flotando, sino que también permite a la NASA estudiar el agua y el hielo de la Tierra desde el espacio.
More
Balanza en el cielo
Balanza en el cielo
A view from one of our flying science laboratories over the ice in Greenland during Operation IceBridge.
More
plane 360
Inside NASA's P-3 aircraft
Video: Simulation of global clouds and aerosols from September 1, 2005, to December 31, 2005.
More
Video: Simulated clouds and...
Video: Simulated clouds and aerosols
This visualization shows the complex patterns of methane emissions produced globally from January 2018 to November 2018.
More
Video: Methane Sources
Visualization that captures sea surface temperature anomalies around the world from 1982 to 2017.
More
Sea surface temperature ano...
Sea surface temperature anomaly timeline: 1982-2017
Fly in 360 degrees over Greenland’s craggy glaciers and other ice formations from NASA’s P-3 aircraft.
More
glacier flyover
Greenland's ice from above
An animation shows global sea level trends from 1993 to 2022 as observed by several satellite missions.
More
Video: Tracking 30 Years of...
Video: Tracking 30 Years of Sea Level Rise
This animation shows the movement of carbon dioxide between the air and sea with the help of ocean surface winds from Jan. 3, 2012 to Aug. 15, 2012.
More
Video: Movement of Carbon D...
Video: Movement of Carbon Dioxide Between the Air and Sea
La NASA no estudia solo las estrellas y los planetas; también le preocupa la tierra debajo de tus pies.
More
La humedad de la Tierra
Video: Global sea level rise is accelerating incrementally over time rather than increasing at a steady rate.
More
New study finds sea level r...
Video: New study finds sea level rise accelerating
Animación simplificada del efecto invernadero.
More
Animación simplificada del ...
Efecto invernadero
Animation showing changes in Antarctic ice mass since 2002 based on satellite data.
More
Video: Antarctic Ice Mass L...
Video: Antarctic Ice Mass Loss 2002-2023
CO2 emissions
More
video about the amount of c...
CO2 video for carbon feature
This visualization shows total sea level change between 1992 and 2019, based on data collected from the TOPEX/Poseidon, Jason-1, Jason-2, and Jason-3 satellites.
More
Video: 27-Year Sea Level Rise
Pliocene CO2 graphic - climate.nasa.gov
More
Pliocene CO2 graphic - clim...
Graphic: Carbon dioxide hits new high
Video: total sea level change between 1992 and 2014, based on data collected from the TOPEX/Poseidon, Jason-1 and Jason-2 satellites.
More
Video: 22-year sea level rise
Antes de la Revolución Industrial, el clima de la Tierra cambiaba debido a eventos naturales como la actividad volcánica y las variaciones de la energía solar.
More
Los sospechosos de siempre
more resources

Explore

Interactives, galleries and apps

Images of Change

Images of Change

Explore a stunning gallery of before-and-after images of Earth from land and space that reveal our home planet in a state of flux.
More
Climate Time Machine

Climate Time Machine

Travel through Earth's recent climate history and see how increasing carbon dioxide, global temperature and sea ice have changed over time.
More
Eyes on the Earth

Eyes on the Earth

Track Earth's vital signs from space and fly along with NASA's Earth-observing satellites in an interactive 3D visualization.
More
Global Ice Viewer

Global Ice Viewer

Earth's ice cover is shrinking. See how climate change has affected glaciers, sea ice, and continental ice sheets.
More
more multimedia

Get the Newsletter

Stay Connected

Facts

    • Evidence
    • Causes
    • Effects
    • Scientific Consensus
    • What Is Climate Change?
    • Vital Signs
    • Extreme Weather
    • Questions (FAQ)

News

    • News and Features
    • Subscribe
    • Climate Newsletter Archive

Solutions

    • Earth Science in Action
    • Mitigation and Adaptation
    • Sustainability and Government Resources

Explore

    • Images of Change
    • Earth Minute Videos
    • Interactives
    • Beautiful Earth Gallery
    • Ask NASA Climate
    • Evidence for Earth's Past Climate

NASA Science

    • Science Mission Directorate
    • NASA Data Resources
    • Earth System Science
    • Earth Science Missions
    • History
    • People

More

    • For Media
    • For Educators
    • Multimedia
    • En español
    • For Kids
  • Feedback
  • |
  • Awards
  • |
  • Sitemap
  • |
  • Earth Observatory
  • |
  • SEA LEVEL CHANGE
  • |
  • Privacy
  • |
  • Climate Data Initiative
  • |
  • U.S. CLIMATE RESILIENCE TOOLKIT

This website is produced by the Earth Science Communications Team at

NASA's Jet Propulsion Laboratory | California Institute of Technology

Site last updated: September 21, 2023