NASA
Global Climate Change
Vital Signs of the Planet
Skip Navigation
menu close modal

MULTIMEDIA

Video: Temperature Puzzle

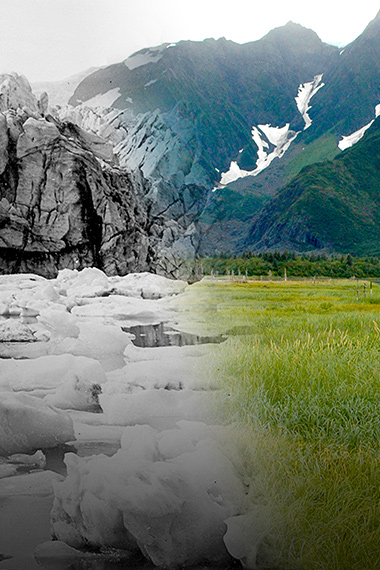
The past decade has been the hottest ever recorded since global temperature records began 150 years ago. This video discusses the impacts of the sun's energy, Earth's reflectance and greenhouse gasses on global warming.

Download the original video.

Credit

NASA

More Like This

  • Videos
  • Global warming
  • Oceans and ice
  • Water cycle

Related

Trick or treat? How many pumpkins would it take to equal the mass of the world’s annual fossil fuel carbon dioxide (CO₂) emissions? Hint: This isn’t a trick 👻
More
Graphic: Carbon Dioxide Emi...
Graphic: Carbon Dioxide Emissions as Pumpkins
A quick guide to the science behind sea level rise from an ice-loss perspective, what it means in relatable terms and why it matters.
More
On Thin Ice: Why Ice Loss M...
On Thin Ice: Why Ice Loss Matters
A visualization of U.S. East Coast ocean flows
More
Video: Ocean Flow Vignettes
Explore Kaneohe Bay with NASA’s CORAL scientists. During field campaigns, scientists take in-water (in situ) measurements to validate the data from airborne instruments.
More
video of divers
Explore Kaneohe Bay with NASA's CORAL scientists
Join NASA Earth scientists for a 360-degree view of our planet as they head into the field to study ice in Greenland and coral reefs in Hawaii.
More
360-video of scientists stu...
Earth 360 Video: The Call of Science
NASA's Landsat 8 satellite captured water mixing between Georgia's ick-colored Suwannee River and the deep blue Gulf of Mexico.
More
Suwannee blackwater river m...
Suwannee blackwater river meets the sea
Along Greenland's western coast, a small field of glaciers surrounds Baffin Bay. This image was acquired by the Landsat 7 satellite on September 3, 2000. It is a false-color composite image made using near-infrared, red and blue wavelengths. 
More
Baffin Bay, Greenland
With autumn's arrival, chlorophyll begins to cede its dominance in the photosynthetic process, revealing yellow and orange tones on land, while in the ocean and lakes, phytoplankton pigments highlight different water masses and current systems.
More
Changing colors across land...
Photosynthetic pigments by land and sea
A view from one of our flying science laboratories over the ice in Greenland during Operation IceBridge.
More
plane 360
Inside NASA's P-3 aircraft
As part of the Arctic Boreal Vulnerability Experiment (ABoVE), NASA scientists are flying over Alaska and Canada, measuring the elevation of rivers and lakes to study how thawing permafrost affects hydrology in the landscape.
More
As part of the Arctic Borea...
Kuskokwim River
Global ice viewer interactive
More
Global ice viewer interactive
Interactive: Global ice viewer
This visualization shows carbon emissions from fires from January 1, 2003 through December 31, 2018. The color bar reflects the quantity of carbon emitted.
More
Carbon Emissions from Fires...
Carbon Emissions from Fires: 2003-2018
The visualization shows monthly global temperature anomalies (changes from an average) between the years 1880 and 2022.
More
Video: Climate Spiral (1880...
Video: Climate Spiral (1880-2022)
Human activities, such as the burning of fossil fuels, have made Earth’s “puffy coat” warmer.
More
Graphic: Carbon Dioxide Tra...
Graphic: Carbon Dioxide Traps Heat, Like a Puffy Coat
Antes de la Revolución Industrial, el clima de la Tierra cambiaba debido a eventos naturales como la actividad volcánica y las variaciones de la energía solar.
More
Los sospechosos de siempre
The Mackenzie River in Canada plays a major role in Arctic climate as warmer fresh water mixes with cold seawater.  This image was taken by the Operational Land Imager on the Landsat 8 satellite on July 18, 2017.
More
The Mackenzie River in Cana...
Mackenzie River
Video: Images created from GRACE data showing changes in Antarctic ice mass since 2002.
More
Antarctic ice loss 2002-2016
Video: Antarctic ice loss 2002-2016
Captured onboard a NASA Operation IceBridge flight to survey glacier change in a warming world, this photograph shows a beach and stream in Russel Fjord, Alaska, near the terminus of Hubbard Glacier.
More
Beached bergs in Alaska
We know seas are rising and we know why. The urgent questions are by how much and how quickly.
More
Infographic: Sea level rise
Animation showing changes in Antarctic ice mass since 2002 based on satellite data.
More
Video: Antarctic Ice Mass L...
Video: Antarctic Ice Mass Loss 2002-2023
Video: how different factors, both natural and industrial, contribute to global warming.
More
How global warming stacks up
Video: How global warming stacks up
NASA explores. From its earliest days of sounding rockets and balloon-borne instruments, to Apollo and Hubble and missions to Mars. This mission of exploration has also always focused on our own corner of the universe, Earth - the home frontier. Earth is still the only planet we've ever been to, as this video explains.
More
NASA explores. From its ear...
Home Frontier
Durante más de 20 años, la NASA ha estado rastreando la topografía de la superficie global del océano para comprender el importante papel que desempeña en nuestras vidas.
More
Aumento del nivel del mar
Quiz: Carbon and the climate
More
Quiz: Carbon and the climate
This animation shows the movement of carbon dioxide between the air and sea with the help of ocean surface winds from Jan. 3, 2012 to Aug. 15, 2012.
More
Video: Movement of Carbon D...
Video: Movement of Carbon Dioxide Between the Air and Sea
more resources

Explore

Interactives, galleries and apps

Images of Change

Images of Change

Explore a stunning gallery of before-and-after images of Earth from land and space that reveal our home planet in a state of flux.
More
Climate Time Machine

Climate Time Machine

Travel through Earth's recent climate history and see how increasing carbon dioxide, global temperature and sea ice have changed over time.
More
Eyes on the Earth

Eyes on the Earth

Track Earth's vital signs from space and fly along with NASA's Earth-observing satellites in an interactive 3D visualization.
More
Global Ice Viewer

Global Ice Viewer

Earth's ice cover is shrinking. See how climate change has affected glaciers, sea ice, and continental ice sheets.
More
more multimedia

Get the Newsletter

Stay Connected

Facts

    • Evidence
    • Causes
    • Effects
    • Scientific Consensus
    • What Is Climate Change?
    • Vital Signs
    • Extreme Weather
    • Questions (FAQ)

News

    • News and Features
    • Subscribe
    • Climate Newsletter Archive

Solutions

    • Earth Science in Action
    • Mitigation and Adaptation
    • Sustainability and Government Resources

Explore

    • Images of Change
    • Earth Minute Videos
    • Interactives
    • Beautiful Earth Gallery
    • Ask NASA Climate
    • Evidence for Earth's Past Climate

NASA Science

    • Science Mission Directorate
    • NASA Data Resources
    • Earth System Science
    • Earth Science Missions
    • History
    • People

More

    • For Media
    • For Educators
    • Multimedia
    • En español
    • For Kids
  • Feedback
  • |
  • Awards
  • |
  • Sitemap
  • |
  • Earth Observatory
  • |
  • SEA LEVEL CHANGE
  • |
  • Privacy
  • |
  • Climate Data Initiative
  • |
  • U.S. CLIMATE RESILIENCE TOOLKIT

This website is produced by the Earth Science Communications Team at

NASA's Jet Propulsion Laboratory | California Institute of Technology

Site last updated: September 21, 2023