NASA
Global Climate Change
Vital Signs of the Planet
Skip Navigation
menu close modal

MULTIMEDIA

Quiz: Our home planet

Quiz: Our home planet

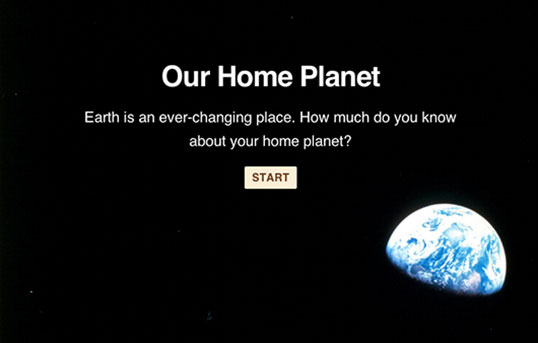
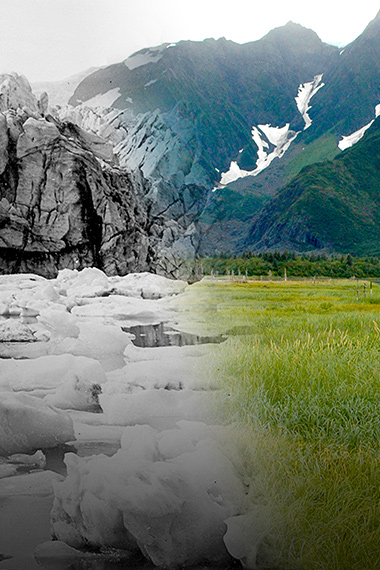
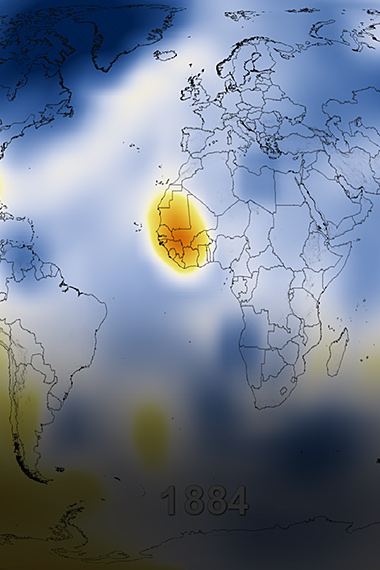
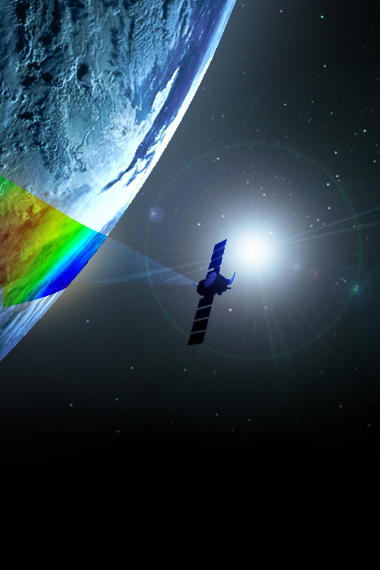
Earth is an ever-changing place. How much do you know about your home planet? Take our quiz.

Browse our collection of climate-related quizzes here.

Credit

NASA Climate Change website

Preview

Embed

Embed this resource by pasting the following code into your website:

<iframe src="https://climate.nasa.gov/quizzes/home-planet-quiz/" width="916" height="620"></iframe>

More Like This

  • Atmosphere
  • Carbon cycle
  • Global warming
  • Land change
  • Oceans and ice
  • Water cycle

Related

This visualization shows that as land temperatures have increased since 1950, hotter days have become more common and colder days have become less common.
More
Watching the Land Temperatu...
Watching the Land Temperature Bell Curve Heat Up (1950-2020)
This view of Earth from space is a fusion of science and art, drawing on data from multiple satellite missions and the talents of NASA scientists and graphic artists.
More
Twin Blue Marbles
Twin Blue Marbles
Los gases de efecto invernadero son vitales para la vida en la Tierra, pero la creciente concentración de ciertos gases, como el dióxido de carbono, está afectando el delicado equilibrio del planeta.
More
Problema de gas
Problema de gas
Video: Explore how scientists determine glacial speed from space.
More
At glacial speed
Video: At glacial speed
By comparing bee data to satellite imagery, NASA research scientist Wayne Esaias uses honey bees as tiny data collectors to understand how climate change is affecting pollination and plants.
More
By comparing bee data to sa...
Video: Sting of Climate Change
This image shows a spinning formation of ice, clouds and low-lying fog off the eastern coast of Greenland. This image was acquired by the Landsat 7 satellite on May 14, 2001. This is a false-color composite image made using infrared, red and green wavelengths.
More
Whirlpool
Whirlpool
Video: how different factors, both natural and industrial, contribute to global warming.
More
How global warming stacks up
Video: How global warming stacks up
Visualization of 30 named storms during the 2020 hurricane season
More
Video: 2020 Hurricane Season
Las nubes son complicadas cuando se trata de la ciencia del clima, ya que calientan y enfrían la Tierra.
More
Las nubes.
Las nubes
B-roll for media on the sea level-observing Sentinel-6 Michael Freilich satellite.
More
Video: Sentinel-6 Michael F...
Video: Sentinel-6 Michael Freilich Media Reel
La NASA no estudia solo las estrellas y los planetas; también le preocupa la tierra debajo de tus pies.
More
La humedad de la Tierra
Nuestra Tierra tiene fiebre. Nuestros científicos creen que la temperatura de la Tierra podría subir de 3 a 10 grados Fahrenheit durante este siglo.
More
La Tierra tiene fiebre
Video: The NASA satellite fleet in 2017, from low Earth orbit to the DSCOVR satellite taking in the million-mile view.
More
Video: NASA&#39;s vantage point...
Video: NASA's vantage point to view Earth
This video shows the accumulation of atmospheric carbon dioxide (CO2) during a single calendar year.
More
Global Carbon Dioxide: 2020...
Global Carbon Dioxide: 2020-2021
Global ice viewer interactive
More
Global ice viewer interactive
Interactive: Global ice viewer
Aprende cómo circula el agua por nuestro planeta. Además, el archivo descargable incluye una página con definiciones de términos.
More
EL CICLO DEL AGUA
Página de colorear: El ciclo del agua
The Mackenzie River in Canada plays a major role in Arctic climate as warmer fresh water mixes with cold seawater.  This image was taken by the Operational Land Imager on the Landsat 8 satellite on July 18, 2017.
More
The Mackenzie River in Cana...
Mackenzie River
Earth has about 370,000,000,000,000,000,000 (quintillion) gallons of water, with some sources easier to access and use than others. The water budget tells us where that water is – key information that helps better plan for the future.
More
Video: Earth&#39;s Water Budget
Video: Earth's Water Budget
This movie shows the evolution of several regions of the Greenland Ice Sheet between 2008 and 2300 based on three different climate scenarios.
More
Greenland Ice Sheet: Three ...
Greenland Ice Sheet: Three Futures
This animation shows how global sea levels have risen more than 80 millimeters (3.15 inches) over the past three decades, which is like covering the U.S. in about 4 meters (about 13 feet) of water over that period.
More
Animation: Global Sea Level...
Animation: Global Sea Level Change (1992-2017)
Head into the field with first responders, fire scientists and forest managers to see what challenges they face and how NASA can help mitigate the effects of longer and more intense fire seasons.
More
Operation Earth: Wildfires
Video: 'Operation Earth: Wildfires'
This visualization shows total sea level change between 1992 and 2019, based on data collected from the TOPEX/Poseidon, Jason-1, Jason-2, and Jason-3 satellites.
More
Video: 27-Year Sea Level Rise
Graphic: Global surface temperature changes versus the Sun's energy that Earth receives in watts (units of energy) per square meter since 1880.
More
Temperature vs Solar Activity
Graphic: Temperature vs Solar Activity
Did you know there’s about 400 parts per million (ppm) of caffeine in coffee? There's over 400 ppm of CO₂ in our atmosphere today. If you've felt the surge of caffeine hitting your system, you've experienced the effects of just 400 ppm.
More
Carbon Dioxide Is Giving Ea...
Carbon Dioxide Is Giving Earth a Jolt!
This visualization shows carbon emissions from fires from January 1, 2003 through December 31, 2018. The color bar reflects the quantity of carbon emitted.
More
Carbon Emissions from Fires...
Carbon Emissions from Fires: 2003-2018
more resources

Explore

Interactives, galleries and apps

Images of Change

Images of Change

Explore a stunning gallery of before-and-after images of Earth from land and space that reveal our home planet in a state of flux.
More
Climate Time Machine

Climate Time Machine

Travel through Earth's recent climate history and see how increasing carbon dioxide, global temperature and sea ice have changed over time.
More
Eyes on the Earth

Eyes on the Earth

Track Earth's vital signs from space and fly along with NASA's Earth-observing satellites in an interactive 3D visualization.
More
Global Ice Viewer

Global Ice Viewer

Earth's ice cover is shrinking. See how climate change has affected glaciers, sea ice, and continental ice sheets.
More
more multimedia

Get the Newsletter

Stay Connected

Facts

    • Evidence
    • Causes
    • Effects
    • Scientific Consensus
    • What Is Climate Change?
    • Vital Signs
    • Extreme Weather
    • Questions (FAQ)

News

    • News and Features
    • Subscribe
    • Climate Newsletter Archive

Solutions

    • Earth Science in Action
    • Mitigation and Adaptation
    • Sustainability and Government Resources

Explore

    • Images of Change
    • Earth Minute Videos
    • Interactives
    • Beautiful Earth Gallery
    • Ask NASA Climate
    • Evidence for Earth's Past Climate

NASA Science

    • Science Mission Directorate
    • NASA Data Resources
    • Earth System Science
    • Earth Science Missions
    • History
    • People

More

    • For Media
    • For Educators
    • Multimedia
    • En español
    • For Kids
  • Feedback
  • |
  • Awards
  • |
  • Sitemap
  • |
  • Earth Observatory
  • |
  • SEA LEVEL CHANGE
  • |
  • Privacy
  • |
  • Climate Data Initiative
  • |
  • U.S. CLIMATE RESILIENCE TOOLKIT

This website is produced by the Earth Science Communications Team at

NASA's Jet Propulsion Laboratory | California Institute of Technology

Site last updated: September 21, 2023