Ask NASA Climate | November 8, 2021, 08:02 PST
Extreme Makeover: Human Activities Are Making Some Extreme Events More Frequent or Intense
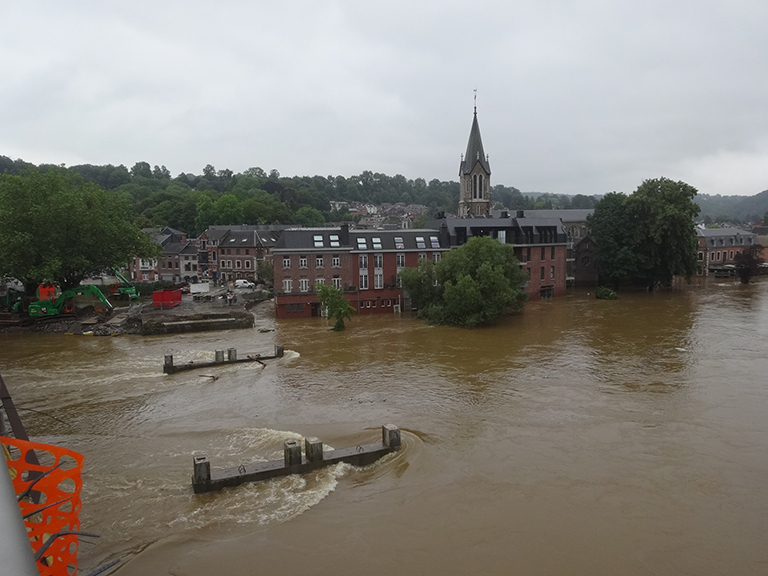
Flooding in the Tilff district of Esneux, a municipality of Wallonia located in the Ourthe Valley in the province of Liege, Belgium, July 16, 2021. Extreme flooding in several European countries in July 2021 resulted in hundreds of fatalities and billions of dollars in property damage. Credit: Régine Fabri, CC BY-SA 4.0, via Wikimedia Commons
The year 2021 has seen a flurry of extreme events around the globe. Among the many that have captured headlines so far this year:
- Devastating flooding in Australia, Europe, Asia, and the U.S. Northeast.
- California’s massive Dixie Fire, now the state’s second largest on record.
- A crippling U.S. polar vortex event that paralyzed Texas in February with bitter cold temperatures and massive power outages.


Western Europe Flooding
In these side-by-side images acquired by the Operational Land Imager (OLI) on the NASA/USGS Landsat 8 satellite, a pre-flood image of the region along the Meuse and Roer rivers (left) from June 16, 2021 contrasts sharply with the image at right from July 18, 2021. Credit: NASA/USGS
From the unique vantage point of space, we’ve been able to observe and monitor these events, no matter where they’ve occurred. Satellite data from NASA and other institutions are critical to understanding how and why extreme events take place.
This year’s events come on the heels of a record-breaking 2020 in the United States. According to the National Oceanic and Atmospheric Administration, there were 22 separate weather and climate-related disasters last year where the overall damages/costs for each reached or exceeded $1 billion. Last year also saw a record number of tropical cyclones form in the Atlantic Basin.

There’s growing evidence that people and the planet are increasingly impacted by extreme events. According to the Fourth National Climate Assessment, published in 2018 by the U.S. Global Change Research Program, “more frequent and intense extreme weather and climate-related events, as well as changes in average climate conditions, are expected to continue to damage infrastructure, ecosystems, and social systems that provide essential benefits to communities.”
As the impacts of extreme events continue to mount, interest has grown in the scientific community to study whether specific extreme events can be partially attributed to human activities. With the help of climate models, scientists have conducted an impressive array of studies, looking for possible links between human activities and extreme events such as heat waves, rainfall and flooding events, droughts, storms, and wildfires.

Increasingly, they’re able to draw robust connections. There are reductions in the number of cold waves, increases in the number of heat waves on the ocean and on land, increases in the intensity of rainfall and drought, and increases in the intensity of wildfires. Despite the complications and uniqueness of individual events, scientists are finding significant human contributions to many of them.
An interactive map produced by CarbonBrief in 2020, shown below, provides visible evidence of these studies. On it, red dots represent different extreme events where scientists have found a substantial contribution from human activities – that is, human activities have made these events more frequent or more intense. For some of the blue dots, however (associated with rainfall events), scientists have yet to find a substantial human contribution.

In this screenshot of an interactive map produced by CarbonBrief, the various symbols represent different types of extreme weather. Red dots indicate extreme events where scientists found a link to human-caused climate change, while blue dots represent studies that found no link, and grey dots indicate studies where results were inconclusive.
The studies show particularly strong links between human activities and marine and land heat waves, intense precipitation, intense droughts, and wildfires. Credit: CarbonBrief
Events with a big thermodynamic component – that is, those where there’s a big impact because of heat – are being made more intense or more frequent because of human activities. In contrast, for extreme events that are more dependent on the dynamics of the atmosphere, the links to human activities are less clear.
Here are a few examples of extreme events where scientists are finding connections to human activities.
Get NASA's Climate Change News: Subscribe to the Newsletter »
Heat Waves

Red areas are where air temperatures climbed more than 27 degrees Fahrenheit (15 degrees Celsius) higher than the 2014-2020 average for the same day. Credit: NASA Earth Observatory image by Joshua Stevens, using GEOS-5 data from the Global Modeling and Assimilation Office at NASA GSFC.
The continued increase in global mean temperatures in response to rising levels of greenhouse gases sets the expectation that we’ll see a corresponding increase in global heat extremes. Indeed, this is being borne out by daily temperature data across the globe. Studies of individual heat waves, such as the devastating event that took place in the Pacific Northwest this summer, suggest such events have become tens to hundreds of times more likely because of human-driven climate change.
A global examination of how often heat waves are occurring, as well as their cumulative intensity (how many days heat waves last above a certain temperature level), published last year by Australian scientists from the Climate Change Research Centre and the University of New South Wales Canberra, reveals a clear increase of more than two days per decade in the number of heat wave days since the 1950s.
Drought

Blue areas have more abundant water than usual, and orange and red areas have less. The darkest reds represent dry conditions that should occur only two percent of the time (about once every 50 years). In the American Southwest, scientists estimate human-caused climate change is making droughts 30 to 50 percent more intense.
NASA Earth Observatory image by Lauren Dauphin, using GRACE data from the National Drought Mitigation Center and data from the United States Drought Monitor at the University of Nebraska-Lincoln.
The intensity of droughts is increasing. It’s not so much that scientists are seeing less rainfall, though that’s certainly happening in some places. Rather, in places where drought conditions exist, soils are becoming drier due to other factors, such as increased soil evaporation and decreased snowpack, which is reducing the amount of river flow during summer and fall. In the American Southwest, scientists estimate human-caused climate change is making droughts 30 to 50 percent more intense. 1
Precipitation
.png?content_type=image%2Fwebp&disposition=inline)
Harvey dropped up to 40 inches (102 centimeters) of rain on some areas. IMERG Data are produced at NASA's Goddard Space Flight Center in Greenbelt, Maryland, using data from the satellites in the Global Precipitation Measurement mission or GPM Constellation, and is calibrated with measurements from the GPM Core Observatory as well as rain gauge networks around the world. Credit: NASA/JAXA, Hal Pierce
When it does rain, we’re also seeing trends in how much rain falls. A prime example is Hurricane Harvey, which caused devasting flooding in parts of Texas in 2017. The storm dropped up to 40 inches (102 centimeters) of rain on some areas.
In locations where scientists have data of sufficient quality, observations are showing an increasing intensity of rainfall. This is coincident with the observed overall increase in atmospheric water vapor (about four percent per degree Fahrenheit of warming). The more water vapor that air contains, the more it can rain out during convection or as air masses collide.

The Australian Bureau of Meteorology reported that areas around Sydney and in the Hunter and Mid North Coast regions were drenched with 400 to 600 millimeters (16 to 24 inches) of rain across four days, with the most extreme totals approaching one meter.
On March 23, 2021, the Operational Land Imager (OLI) on the NASA/USGS Landsat 8 satellite acquired a natural-color image of flooding in the Hawkesbury-Nepean River system along the western edge of Sydney. Credit: NASA/USGS
There have been hurricanes and intense storms throughout history, so what’s changed? Model studies confirm that, for instance, about 20 percent of Harvey’s rainfall was attributable to human-produced warming of the climate and waters in the Gulf of Mexico. 2, 3 More generally, climate simulations confirm that this increased intensity is a robust result.
It’s important to note that impacts from extreme events are mainly a question of thresholds – the amount of flooding needed to overtop a levee, or overwhelm storm drains – so every inch (of additional rain) counts. So, while total rainfall may increase only slightly, it’s the extreme precipitation events that disproportionately cause problems.

The Bottom Line
The combination of models and observations, informed by the unique view that space provides, imply that almost all the current multi-decadal trends we’re seeing in climate are the result of human activities. In addition, there’s increasing confidence that human-induced climate change is making extreme events statistically much more likely.
This doesn’t mean every extreme event has a substantial human contribution. But with extreme events such as heat waves, wildfires and intense precipitation, we’re seeing, in event after event, a very clear human fingerprint.

References
- Williams, A.P.; Cook, E.R.; Smerdon, J.E.; Cook, B.I.; Abatzoglou, J.T.; Bolles, K.; Baek, S.H.; Badger, A.M.; Livneh, B. 2020: Large contribution from anthropogenic warming to an emerging North American megadrought. Science. 368 (6488), 314-318, doi:10.1126/science.aaz9600.
- van Oldenborgh, G.J.; van der Wiel, K.; Sebastian, A.; Singh, R.; Arrighi, J.; Otto, F.; Haustein, K.; Li, S.; Vecchi, G.; Cullen, H. 2017: Attribution of extreme rainfall from Hurricane Harvey. Environ. Res. Lett. 12. 124009.
- Risser M.D.; Wehner M.F. 2017. Attributable human-induced changes in the likelihood and magnitude of the observed extreme precipitation during Hurricane Harvey. Geophys Res Lett. 44:12, 457–12, 464.