Ask NASA Climate | March 9, 2022, 11:41 PST
Too Hot to Handle: How Climate Change May Make Some Places Too Hot to Live
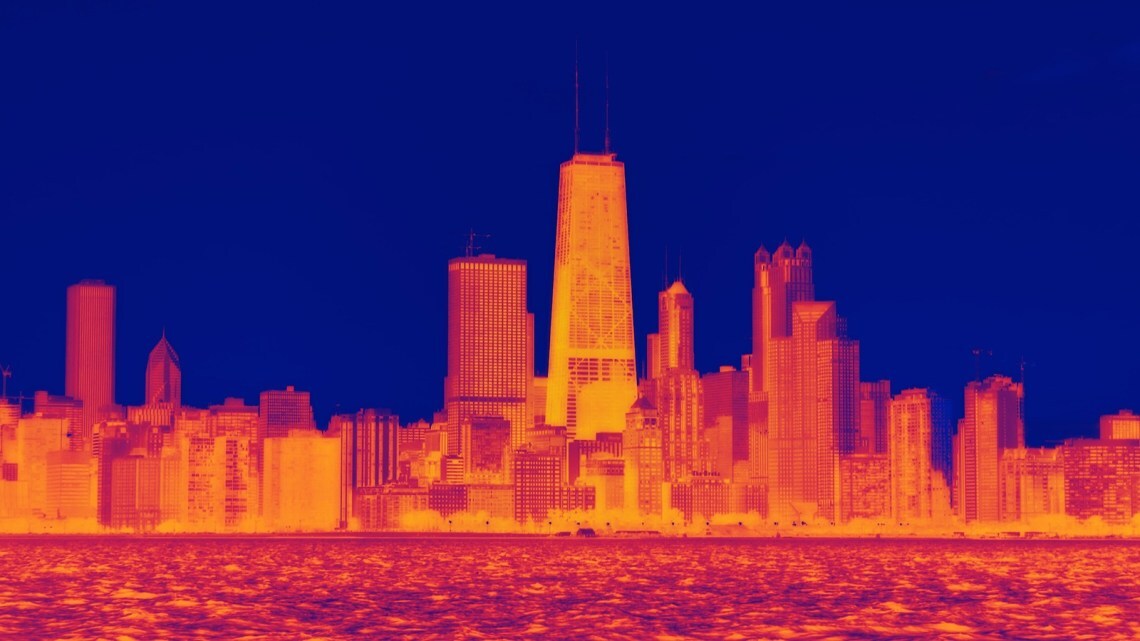
Extreme levels of heat stress have more than doubled in the last 40 years, with significant implications for human health. Credit: Dustin Phillips (Flickr) CC BY-NC-ND 2.0.
How hot is too hot?
As Earth’s climate warms, heat waves are becoming more frequent and severe. The health dangers of extreme heat have scientists and medical experts increasingly concerned. And for good reason: heat stress is a leading cause of weather-related deaths in the United States each year. A recent example is the record-breaking heat wave that hit the U.S. Pacific Northwest last summer, killing hundreds.
Extreme levels of heat stress have more than doubled over the past 40 years. That trend is expected to continue, says Colin Raymond of NASA’s Jet Propulsion Laboratory in Southern California. Raymond is lead author of a 2020 study on extreme heat and humidity, published in Science Advances.
Weather forecasters use different tools to assess the potential for heat stress. Indeed, measurements of heat stress figure prominently in your daily weather report. In addition to forecasts of temperature and relative humidity, you’ll see something called the heat index, or apparent temperature. The heat index is a measure of what the air temperature feels like to our bodies when relative humidity is factored in. Calculated for shady areas, the heat index reflects how uncomfortable we feel when it’s hot and humid.
Because the heat index requires calibration, it’s a somewhat subjective measurement. In fact, different countries use different versions of it. For this reason, scientists conducting global climate studies are looking increasingly at another measure of heat stress called wet-bulb temperature.
Wet-bulb temperature is the lowest temperature to which an object can cool down when moisture evaporates from it. The lower the wet-bulb temperature, the easier it is for us to cool down. It measures how well our bodies cool down by sweating when it’s hot and humid, and tells us if conditions may be harmful to our health, or even deadly.
Both wet-bulb temperature and heat index are calculated using data on air temperature and humidity -- the two most important factors that affect heat stress. However, wet-bulb temperature is measured using a different technique.
Originally, wet-bulb temperature was measured by wrapping a wet cloth around the bulb of a thermometer and exposing it to air. As water evaporated from the cloth, the thermometer recorded the drop in temperature. The higher the relative humidity, the less moisture evaporated before the bulb and the surrounding air are the same temperature. Today, wet-bulb temperature is typically calculated using measurements from electronic instruments at weather stations.
Raymond says the highest wet-bulb temperature that humans can survive when exposed to the elements for at least six hours is about 95 degrees Fahrenheit (35 degrees Celsius).
Wet-bulb temperatures are on the rise around the world, and Earth’s climate has begun to exceed this limit.
Since 2005, wet-bulb temperature values above 95 degrees Fahrenheit have occurred for short periods of time on nine separate occasions in a few subtropical places like Pakistan and the Persian Gulf. They also appear to be becoming more frequent. In addition, incidences of slightly lower wet-bulb temperature values in the 90 to 95-degree Fahrenheit (32 to 35-degree Celsius) range have more than tripled over the 40 years studied by Raymond’s team.
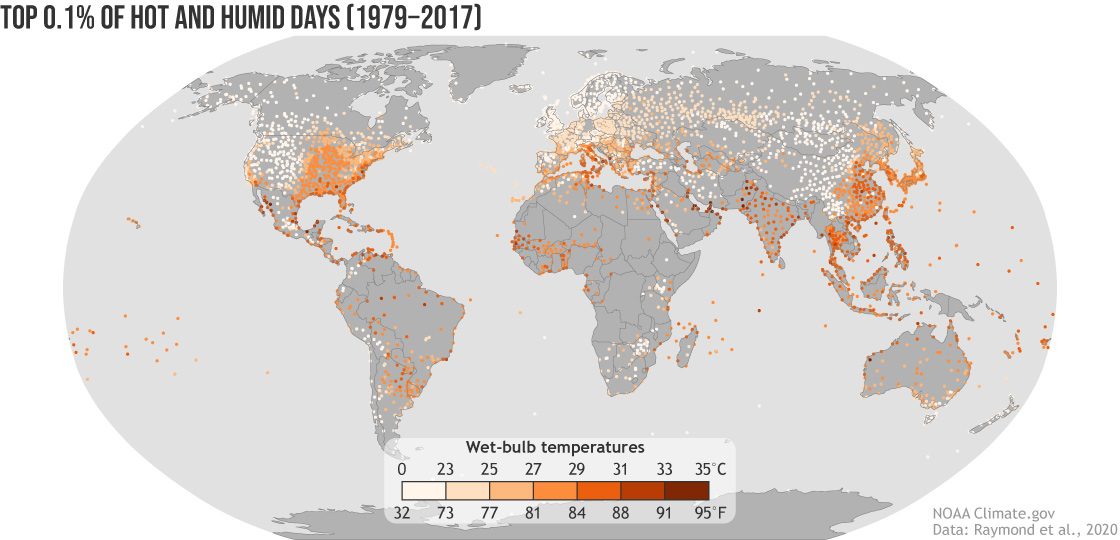
The results have important implications. The hotter it is, the more strain our bodies feel, and the more we need to sweat to cool down. But humid air has less capacity to hold additional moisture, so water evaporates more slowly in humid conditions.
Think about when you step out of a hot shower. Water evaporates off your body and you feel cooler. But if it’s hot or humid (or both) in the room, it’s harder to feel cool. This feeling relates directly to what the wet-bulb temperature is measuring.
As long as the wet-bulb temperature is well below your skin temperature, your body can release heat to your surroundings through radiation and sweating. But as the wet-bulb temperature approaches your core temperature, you lose the ability to cool down. This triggers changes in your body. You dehydrate. Your organs become stressed, especially your heart. Blood rushes to your skin to try to release heat, starving your internal organs. The results can be deadly.
“Once the wet-bulb temperature exceeds 35 degrees Celsius (95 degrees Fahrenheit), no amount of sweating or other adaptive behavior is enough to lower your body to a safe operating temperature,” Raymond said. “Most of the time it’s not a problem, because the wet-bulb temperature is usually 5-to-10 degrees Celsius below body temperature, even in hot, humid places.”
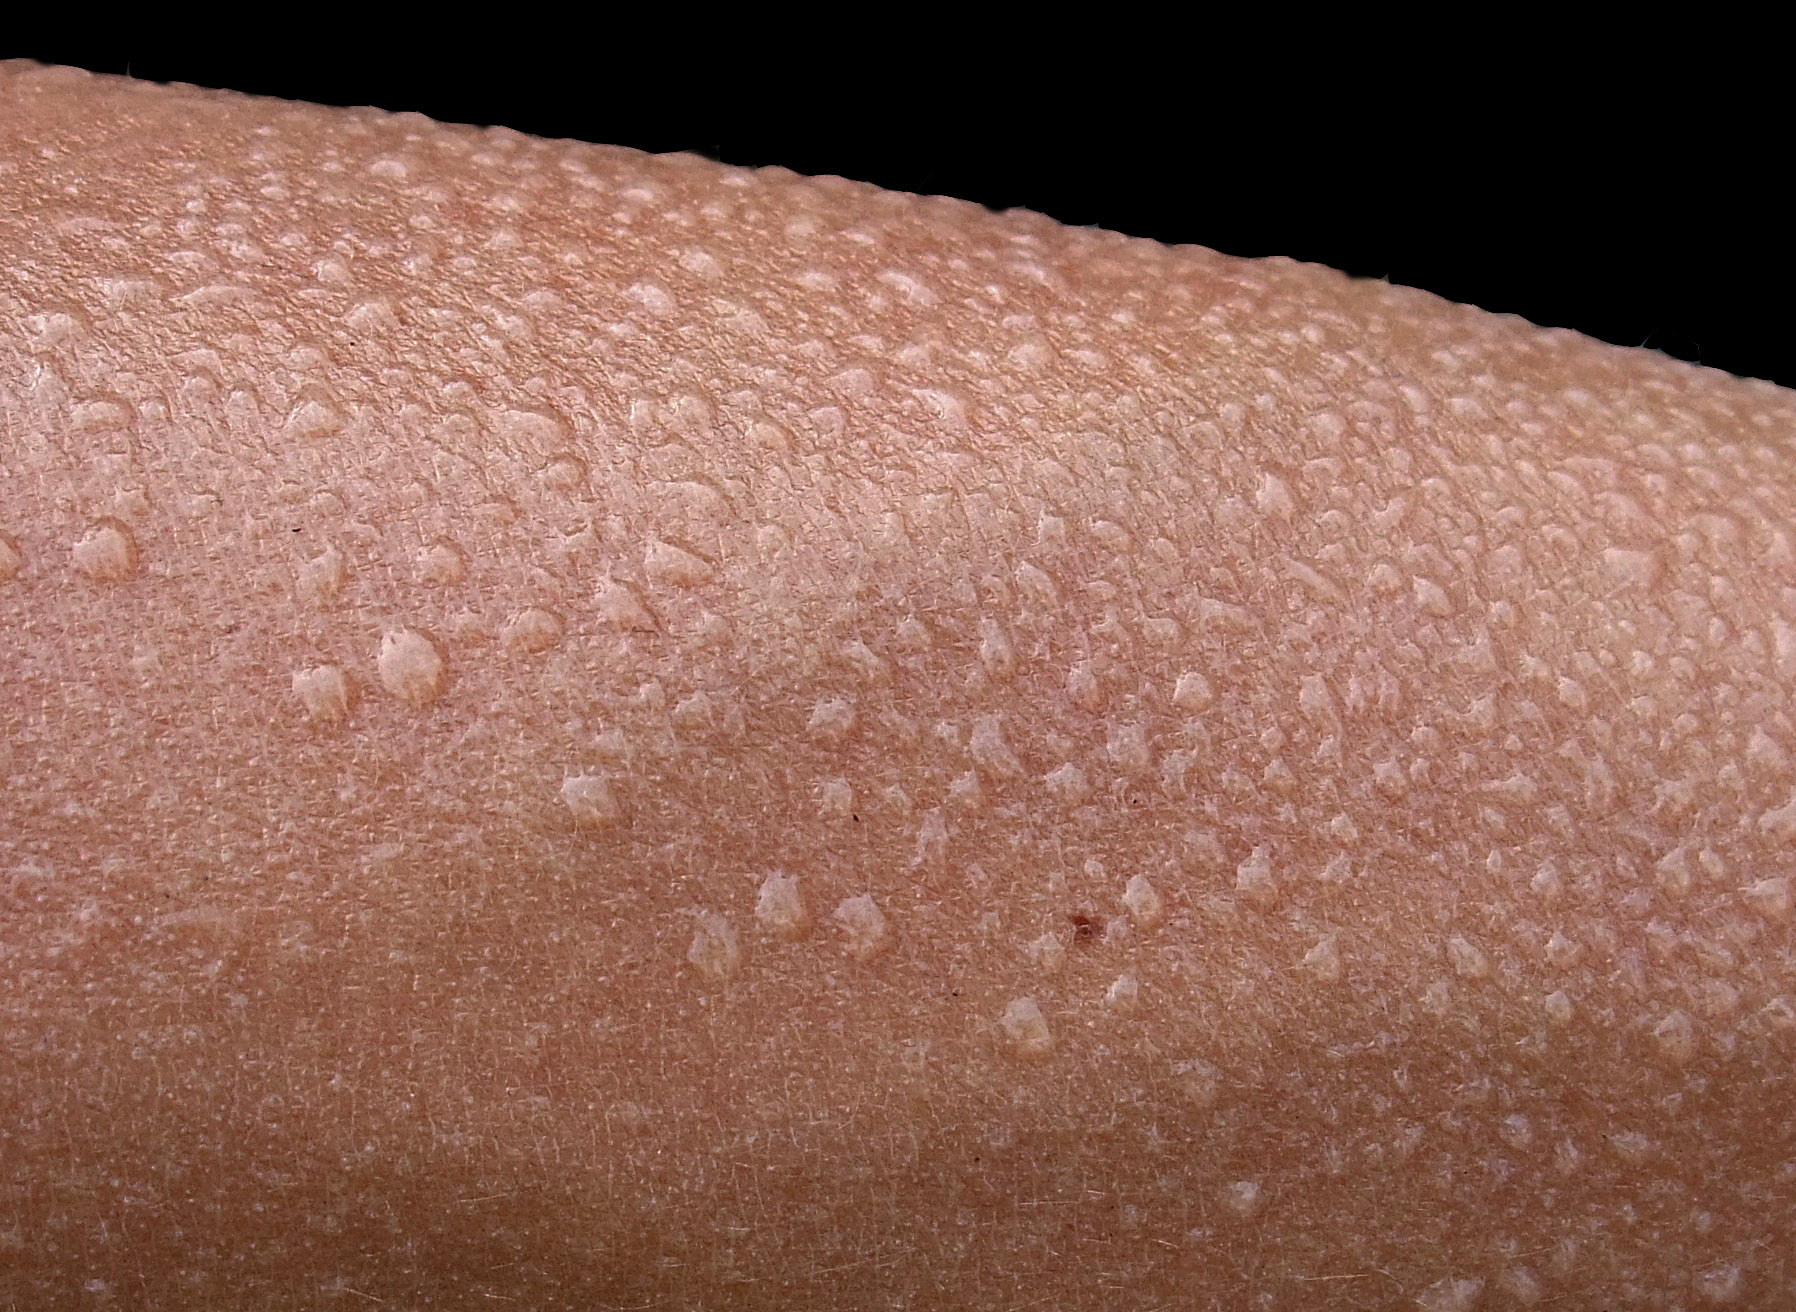
Indeed, if humidity is low, extreme temperatures are tolerable. “If you’re sitting in the shade with unlimited drinking water in California’s Death Valley, conditions may not be pleasant, but they’re survivable,” Raymond said. “But in humid regions, once you approach wet-bulb temperatures of 34-to-36 degrees Celsius (93-to-97 degrees Fahrenheit), it doesn’t matter what you’re doing. You can’t survive for extended periods of time.”
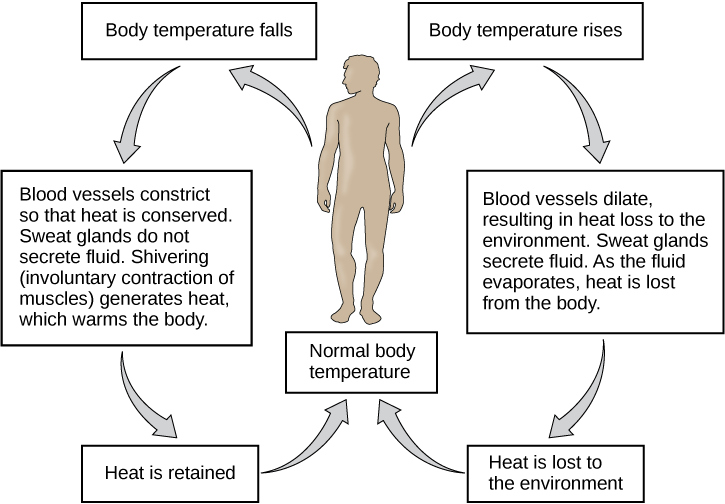
Those most susceptible to high wet-bulb temperatures include the elderly, people who work outside, and those with underlying health issues. People without access to air conditioning are also vulnerable. Air conditioning removes humidity from the air and is the best solution when wet-bulb temperatures get too high. Fans can help sweat evaporate more efficiently, but they’re less effective.
Raymond noted that people die of heat stress at wet-bulb temperatures much lower than 95 degrees Fahrenheit (35 degrees Celsius). For example, the wet-bulb temperature during the June 2021 Pacific Northwest heatwave was closer to 77 degrees Fahrenheit (25 degrees Celsius).

How Satellites Can Help
Many places with extreme wet-bulb temperatures are in developing countries in the subtropics with few reliable long-term weather stations. This makes it difficult to fully understand extreme heat events. However, satellite data can help identify hot spots and the processes that drive high wet-bulb temperature in such locations.
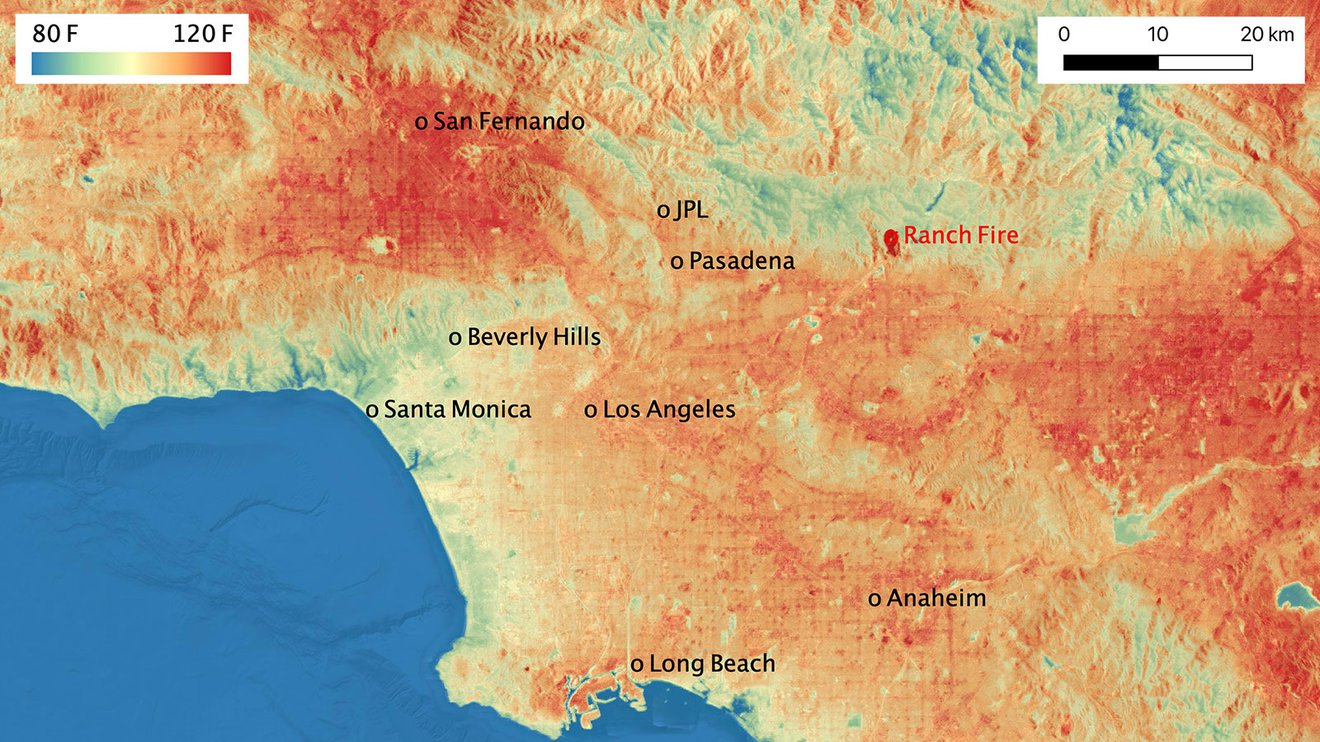
That’s where NASA Earth observations play an important role. Instruments in space like the Atmospheric Infrared Sounder (AIRS) on NASA’s Aqua satellite and the ECOsystem Spaceborne Thermal Radiometer Experiment (ECOSTRESS) on the International Space Station (ISS) provide useful data for studying heat stress. Scientists are using these data to develop computer models of regional heat events. These models allow them to zoom in on specific places to study their temperature and humidity in detail. Future projects, like NASA’s Surface Biology and Geology (SBG) mission, presently under formulation, will provide even higher-resolution data on important processes like evaporation.
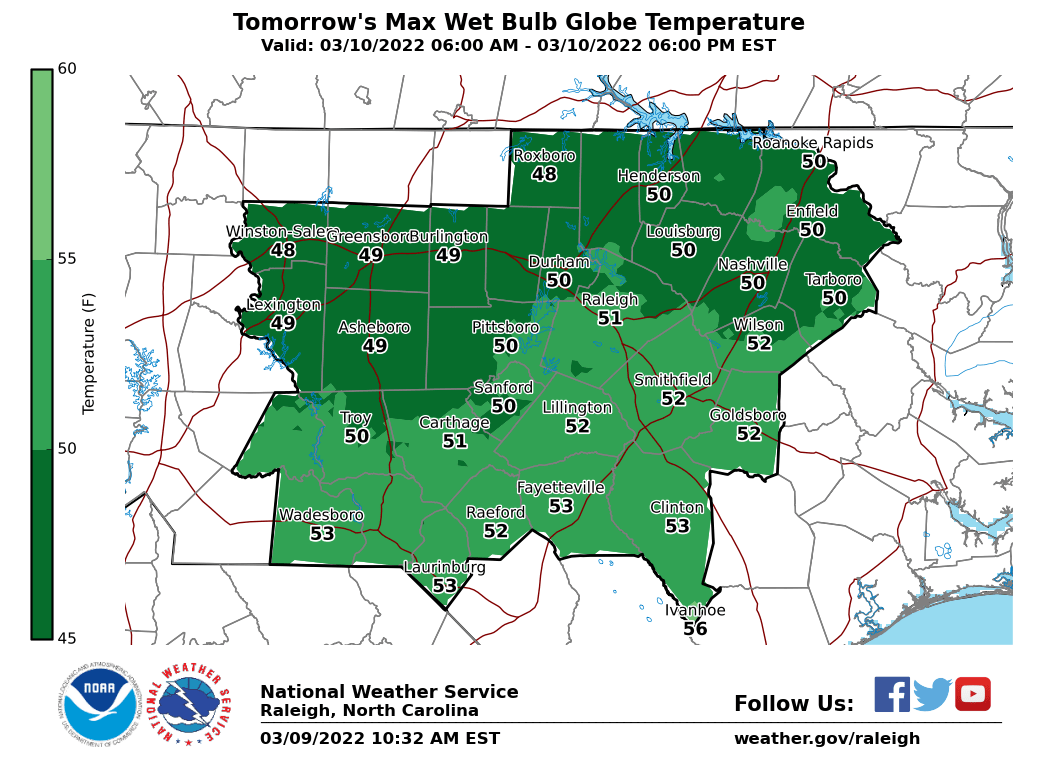
These new tools can also help provide the necessary data to calculate a more advanced metric of heat stress, called the wet-bulb globe temperature (WBGT). WBGT also uses temperature and humidity data, but factors in wind speed, sun angle, and cloud cover (solar radiation), variables for which reliable data are limited across much of the globe. A prototype Wet-Bulb Globe Temperature product is being developed by the National Oceanic and Atmospheric Administration for improved heat-stress forecasts in the United States. However, wet-bulb temperature remains the standard for measuring oppressive heat and humidity, particularly for long-term global climate research.
Future Hot Spots
Raymond says it’s hard to say when we might see global wet-bulb temperatures regularly topping 95 degrees Fahrenheit (35 degrees Celsius). That’s because it’s a complex process that’s happening gradually and unfolding differently in different places. But climate models tell us certain regions are likely to exceed those temperatures in the next 30-to-50 years. The most vulnerable areas include South Asia, the Persian Gulf, and the Red Sea by around 2050; and Eastern China, parts of Southeast Asia, and Brazil by 2070.
The United States isn’t immune, however. Within 50 years, Midwestern states like Arkansas, Missouri, and Iowa will likely hit the critical wet-bulb temperature limit.
