News | January 26, 2014
Satellites help power grid keep its balance
Credit: Shutterstock
Imagine a generator pumping more electricity than a nuclear power plant into the grid, but inconsistently and without the grid’s caretakers being able to see what it was doing. How could they maintain the critical balance between generation and consumption that the grid requires? A key to the answer hovers some 22,000 miles overhead.
The amount of electricity fed into an electrical grid at any given moment must equal the amount that is being used at that moment. Too much or too little could damage the millions of electrical devices connected to the grid or even trigger a power outage. Nine of North America’s largest grids have special independent organizations charged with maintaining that balance.
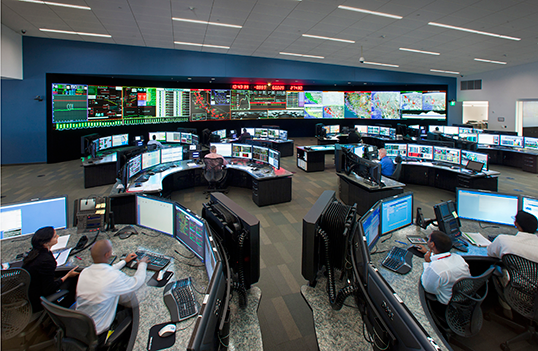
California Independent Service Operator (ISO) manages the grid that serves most of California and a chunk of Nevada. They rebalance the grid’s intake and output every four seconds, using sophisticated algorithms to forecast demand and a variety of ways to adjust the wattage they introduce into the system throughout the day. But they can only manage what they can see: the big power plants that produce the bulk of the system’s electricity. “We can’t see the solar panels on the rooftop of your house,” said Jim Blatchford, the ISO’s short-term forecasting manager. “We don’t know how much they are reducing your demand or feeding back into the grid.” And that’s a significant challenge.
More electricity than a power plant
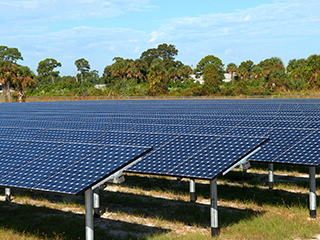
The nearly 200,000 solar installations on private homes and businesses in California, taken together, generate more electricity than any power plant in the state. Clearly, grid managers need to take them into account to calculate accurately how much electricity the grid should carry.
But this multitude of small solar setups is scattered over a vast area with a wide range of highly variable weather conditions that affect how much sunlight each one receives—and therefore how much electricity it produces—at any given moment. The sun may shine brightly on a rooftop in Bakersfield while a bungalow in Santa Monica is shrouded in fog. When the fog lifts and those panels begin to produce, a morning shower may dampen productivity in San Francisco while a giant cloud bank plays peekaboo with the sun over Sacramento.
Tracking all those solar panels and their ever-changing environments may seem like herding cats, but a company called Clean Power Research (CPR) has developed a solution that the California ISO is currently testing. CPR accumulated information about the state’s small solar installations by playing a role in registering them for rebates. So they know where the solar panels are and the size, angle and shading characteristics of each group.
What remains is to determine how much sunlight reaches each set of solar panels at any given time, and that’s where the Geostationary Operational Environmental Satellite (GOES) system comes in.
CPR uses a stream of data from GOES in real time to characterize how much sunlight each relevant square kilometer of California is receiving and to forecast how the picture is going to change over the course of a week. “If you look at a series of those GOES images, you can track the motion of the clouds,” said Adam Kankiewicz, Solar Research Specialist at CPR. “You can say if it’s gone from here to here in the last hour, we predict that it’s going to go, say, 10 kilometers in that direction in two hours. For short-term forecasting, that's the most accurate method out there.”
Hour by hour
“We model each of those nearly 200,000 systems individually,” said Mark Liffmann, who is Vice President of Business Development, Sales and Marketing at CPR. “We use the irradiance (the measurement of sunlight intensity) to determine how much electricity each system is likely to produce each hour for the next seven days, and then we aggregate those forecasts and feed that into the ISO’s software so they can determine how much generation they’ll need to meet the net load.”
CPR’s software and the ISO’s software engage in an ongoing dialogue to keep the balancing authority up to date. “It needs to happen quickly in real time,” Liffmann said. “You need the ongoing forecast continuously to be able to accurately calculate what solar panels are going to provide and therefore what traditional resources you are going to need to turn on and off.”
California ISO’s Blatchford points out that the monitoring and forecasting that GOES enables can also help his organization determine what to expect from the large, commercial solar stations in its system. Their output is just as dependent on weather conditions as a small rooftop system.
“The sun angle plays a big part in it, too,” he said. “A cloud 10 miles away from the plant could be in between the plant and the sun.”
Despite the challenges they present, having California’s single largest generator in the form of 200,000 widely dispersed solar-panel setups has a big potential upside. “It gives you two advantages,” Liffmann said. “One, you don’t have a single point of failure. If one system goes down, it’s a small percentage of the total generation. The other is that it smooths out a lot of the weather variation. As long as you can forecast it well, it’s a great benefit.”
And the view from 22,000 miles up is indispensible to making those forecasts. “GOES satellites are the only available source for the images we need over North America,” Kankiewicz said.

