News | January 25, 2015
Data peers into Greenland's ice sheet
A three-dimensional view of the age and structure of the Greenland Ice Sheet
Scientists using ice-penetrating radar data collected by NASA’s Operation IceBridge and earlier airborne campaigns have built the first-ever comprehensive map of layers deep inside the Greenland Ice Sheet.
Peering into the thousands of frozen layers inside Greenland’s ice sheet is like looking back in time. Each layer provides a record of what Earth’s climate was like at the dawn of civilization, or during the last ice age, or during an ancient period of warmth similar to the one we experience today. Credit: NASA Goddard's Scientific Visualization Studio. Download this video in HD formats from NASA Goddard's Scientific Visualization Studio.
This new map allows scientists to determine the age of large swaths of Greenland’s ice, extending ice core data for a better picture of the ice sheet’s history. “This new, huge data volume records how the ice sheet evolved and how it’s flowing today,” said Joe MacGregor, a glaciologist at The University of Texas at Austin’s Institute for Geophysics and the study’s lead author.
Greenland’s ice sheet is the second largest mass of ice on Earth, containing enough water to raise ocean levels by about 20 feet. The ice sheet has been losing mass over the past two decades and warming temperatures will mean more losses for Greenland. Scientists are studying ice from different climate periods in the past to better understand how the ice sheet might respond in the future.
One way of studying this distant past is with ice cores. These cylinders of ice drilled from the ice sheet hold evidence of past snow accumulation and temperature and contain impurities like dust and volcanic ash that were carried by snow that accumulated and compacted over hundreds of thousands of years. These layers are visible in ice cores and can be detected with ice-penetrating radar.
Ice-penetrating radar works by sending radar signals into the ice and recording the strength and return time of reflected signals. From those signals, scientists can detect the ice surface, sub-ice bedrock and layers within the ice.
New techniques used in this study allowed scientists to efficiently pick out these layers in radar data. Prior studies had mapped internal layers, but not at the scale made possible by these newer, faster methods. Another major factor in this study was the amount of Greenland IceBridge has measured.
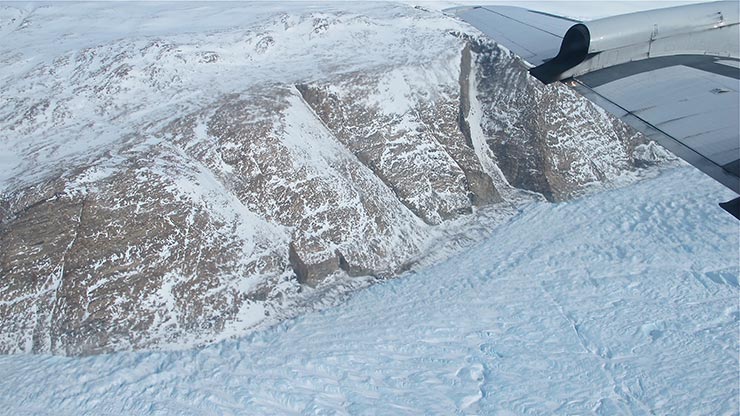
“IceBridge surveyed previously unexplored parts of the Greenland Ice Sheet and did it using state-of-the-art CReSIS radars,” said study co-author, Mark Fahnestock, a glaciologist from the Geophysical Institute at University of Alaska Fairbanks and IceBridge science team member. CReSIS is the Center for Remote Sensing of Ice Sheets, a National Science Foundation Science and Technology Center headquartered at the University of Kansas in Lawrence, Kansas.IceBridge’s flight lines often intersect ice core sites where other scientists have analyzed the ice’s chemical composition to map and date layers in the ice. These core data provide a reference for radar measurements and provide a way to calculate how much ice from a given climate period exists across the ice sheet, something known as an age volume. Scientists are interested in knowing more about ice from the Eemian period, a time from 115,000 to 130,000 years ago that was roughly as warm as today. This new age volume provides the first rough estimate of where Eemian ice may remain.
Comparing this age volume to simple computer models helped the study’s team better understand the ice sheet’s history. Differences in the mapped and modeled age volumes point to past changes in ice flow or processes like melting at the ice sheet’s base. This information will be helpful for evaluating the more sophisticated ice sheet models that are crucial for projecting Greenland’s future contribution to sea-level rise. “Prior to this study, a good ice-sheet model was one that got its present thickness and surface speed right. Now, they’ll also be able to work on getting its history right, which is important because ice sheets have very long memories,” said MacGregor.
This study was published online on Jan. 16, 2015, in Journal of Geophysical Research Earth Surface. It was a collaboration between scientists at UTIG, UAF-GI, CReSIS and the Dept. of Earth System Science at University of California, Irvine. It was supported by NASA’s Operation IceBridge and the National Science Foundation’s Arctic Natural Sciences.


