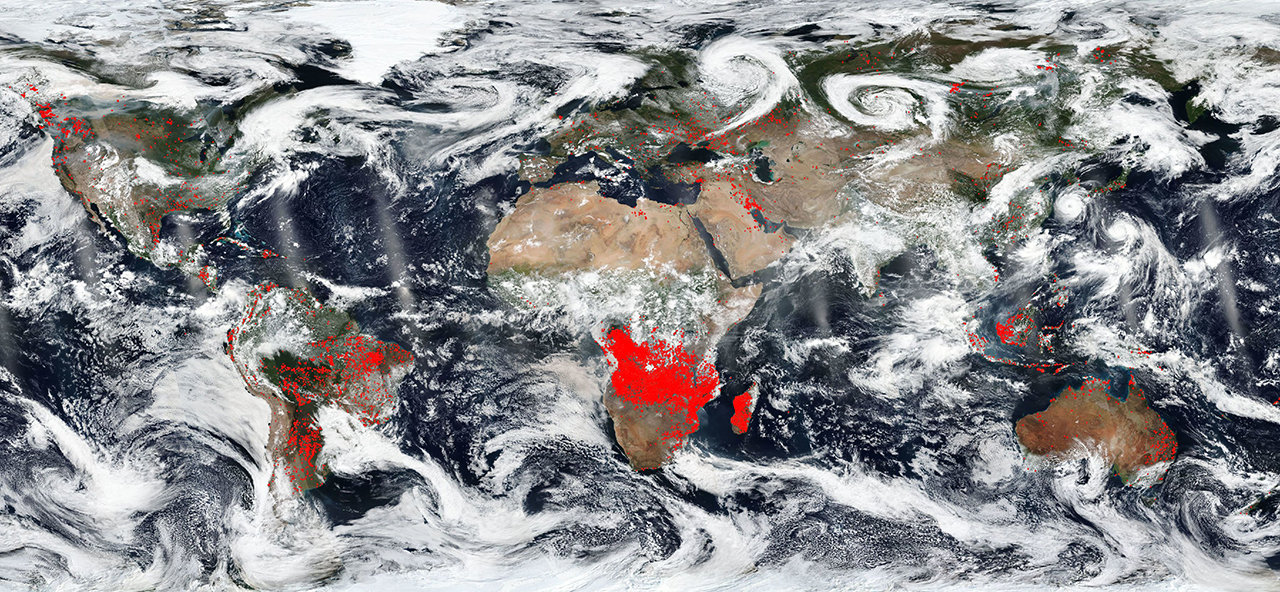
The world is on fire. Or so it appears in this image from NASA's Worldview software. The red points overlaid on the image designate those areas that by using thermal bands detect actively burning fires. Africa seems to have the most concentrated fires. This could be due to the fact that these are most likely agricultural fires. The location, widespread nature, and number of fires suggest that these fires were deliberately set to manage land. Farmers often use fire to return nutrients to the soil and to clear the ground of unwanted plants. While fire helps enhance crops and grasses for pasture, the fires also produce smoke that degrades air quality.
Elsewhere the fires, such as in North America are wildfires for the most part. In South America, specifically Chile has had horrendous numbers of wildfires this year. A study conducted by Montana State University found that: "Besides low humidity, high winds and extreme temperatures—some of the same factors contributing to fires raging across the United States—central Chile is experiencing a mega drought and large portions of its diverse native forests have been converted to more flammable tree plantations, the researchers said." More on this study can be found here: https://phys.org/news/2018-08-massive-south-central-chile.html#jCp.
However, in Brazil the fires are both wildfires and man-made fires set to clear crop fields of detritus from the last growing season. Fires are also commonly used during Brazil’s dry period to deforest land and clear it for raising cattle or other agricultural or extraction purposes. The problem with these fires is that they grow out of control quickly due to climate issues. Hot, dry conditions coupled with wind drive fires far from their original intended burn area. According to the Global Fire Watch site (between Aug. 15 and Aug. 22) shows: 30,964 fire alerts.
Australia is also where you tend to find large bushfires in its more remote areas. Hotter, drier summers in Australia will mean longer fire seasons – and urban sprawl into bushland is putting more people at risk for when those fires break out. For large areas in the north and west, bushfire season has been brought forward a whole two months to August – well into winter, which officially began June 1. According to the Australian Bureau of Meteorology (Bom), the January to July period 2018 was the warmest in NSW since 1910. As the climate continues to change and areas become hotter and drier, more and more extreme bushfires will break out across the entire Australian continent.
NASA's Earth Observing System Data and Information System (EOSDIS) Worldview application provides the capability to interactively browse over 700 global, full-resolution satellite imagery layers and then download the underlying data. Many of the available imagery layers are updated within three hours of observation, essentially showing the entire Earth as it looks "right now. This satellite image was collected on Aug. 22, 2018. Actively burning fires, detected by thermal bands, are shown as red points. Image Courtesy: NASA Worldview, Earth Observing System Data and Information System (EOSDIS). Caption: Lynn Jenner with information from Global Fire Watch, Australian Bureau of Meteorology, and Phys.org.
See the image in Worldview: https://go.nasa.gov/2BRck1Z.

