News | August 31, 2011
Asia, wind, water and fire

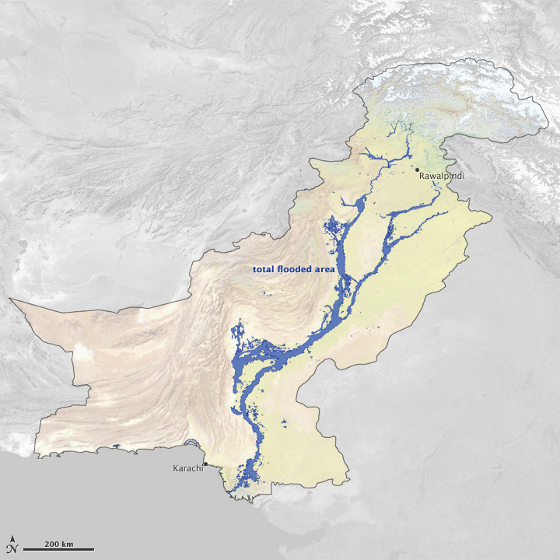
Floods covered at least 14,390 square miles (37,280 square kilometers) of Pakistan between July 28 and September 16, 2010. For more information about this image, visit this page. Credit: NASA Earth Observatory
By Rani Gran and Adam Voiland
NASA Goddard Space Flight Center
Two of the most destructive natural disasters of 2010 were closely linked by a single meteorological event, even though they occurred 1,500 miles (2,414 kilometers) apart and were of completely different natures, a new NASA study suggests.
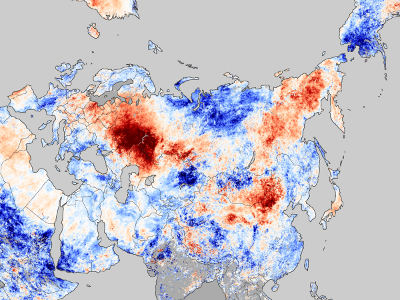
The research finds that the same large-scale meteorological event — an abnormal Rossby wave — sparked extreme heat and persistent wildfires in Russia as well as unusual downstream wind patterns that shifted rainfall in the Indian monsoon region and fueled heavy flooding in Pakistan. Although the heat wave started before the floods, both events attained maximum strength at approximately the same time, the researchers found by analyzing satellite data generated by NASA instruments capable of measuring the land surface temperature, precipitation intensity and wildfire activity.
William Lau and Kyu-Myong Kim, atmospheric scientists at NASA’s Goddard Space Flight Center in Greenbelt, Md., authored the study, which the Journal of Hydrometeorology published in August.
A Rossby connection The atmosphere, gaseous and transparent, may not seem like a fluid, but that’s precisely how the thin layer of air encasing the planet behaves. As Earth spins on its axis, huge rivers of air — scientists call them Rossby waves — meander around the globe in a westerly direction. Currents in the center of these waves form the jet streams, fast-moving columns of air that push weather systems from west to east.
Rossby waves aren’t uniform. They tend to undulate and have troughs and ridges. Areas of low-pressure typically develop in the troughs of the waves, while high-pressure areas form in their ridges. Parcels of warm air from the tropics and cool air from the poles swirl around the low- and high-pressure parts of the waves creating a complex tapestry of warm and cool fronts that meet and interact constantly. Collisions between warm and cool fronts produce storms and precipitation.
Under normal summertime conditions, the jet stream pushes weather fronts through Eurasia in four or five days, but something unusual happened in July of 2010. A large-scale, stagnant weather pattern — known as an Omega blocking event — developed over a high-pressure ridge above western Russia. This blocking event, which divided the jet stream, had the effect of slowing the Rossby wave and prevented the normal progression of weather systems from west to east.
As a result, a large region of high pressure formed over Russia and trapped a hot, dry air mass. As the high lingered, the land surface dried and the normal transfer of moisture from the soil to the atmosphere slowed. Precipitation ceased, vegetation dried out, and the region became a taiga tinderbox.
Meanwhile, the blocking pattern created unusual downstream wind patterns over Pakistan. Areas of low pressure on the leading edge of the Rossby wave formed in response to the high that pulled cold, dry Siberian air into lower latitudes.
"From NASA satellite data and wind analysis, we can clearly see the connection between the two events," Lau said. "Think of the atmosphere like a loose membrane. If you push one part up, something else has to come down somewhere else. If you produce a high in one region, you produce a corresponding low in another."
This cold air from Siberia clashed with warm, moist air arriving over Pakistan from the Bay of Bengal. There’s nothing unusual about moisture moving north over India toward the Himalayas. It’s a normal part of the monsoon. However, in this case, the unusual wind patterns associated with the blocking high brought upper level air disturbances farther south than is typical, which helped shift the entire monsoon rainfall system north and west. The shift brought heavy monsoon rains squarely over the northern part of Pakistan.
Future directions While the new study highlights the degree of interconnection that can exist between two seemingly unrelated weather events, Lau cautions that many questions remain. For example, why did such a powerful blocking high form in the first place? And did some particular process occurring on the land or in the atmosphere sustain and strengthen it?

Lau’s analysis of data from the Modern Era Retrospective-analysis for Research and Applications (MERRA) — an atmospheric model focused on hydrology that blends data from satellites and the Goddard Earth Observing System Model, Version 5 (GEOS-5) — suggests that certain interactions between the land and atmosphere may have amplified the heat wave as it dragged on creating what climatologists call a positive feedback cycle.
Clouds, for example, typically provide shade and precipitation, but Lau’s research shows they were suppressed in the vicinity of the blocking high because prolonged drought dried the soil and slowed the rate of evaporation. The modeling and satellite data suggest that over time the reduced cloud cover would have resulted in an even greater dose of heat reaching the surface, which, in turn, would have dried the soil out even more and amplified the effect.
What’s more, Lau thinks that graphite-like dark particles in wildfire smoke — a type of aerosol called black carbon — may have helped burn clouds away, making the surface even drier and more fire prone. "We need more research to say for sure whether land and aerosol feedback sustained the high, but this study suggests it’s possible," said Ralph Kahn, an atmospheric scientist at Goddard who wasn’t involved in the study.
